Narrowing down the claims

Introduction
This is a Deliberate Practice (DP) exercise to break down statements into testable claims. This is then tested with 1 example.
P.S.
The power of using at least 1 example is motivated in this
post. I send these DP exercises to a friend who gives me lots of
detailed feedback. Example of the feedback is shown at the end of this
Practice session.
Essay on bottleneck
Based on: Talent constrained post
EA orgs hiring
Claim: EA orgs don’t seem to be able to hire the number of Entrepreneurs they set out to hire, at the end of a hiring round.
Re-write claim: The number of people who were accepted at the end of the year for Entrepreneurs, is less than the number of incubees budgeted for at the beginning of the year.
Subject: The Number of people who were “accepted” by the end of the year for entrepreneurs,
Predicate: is lesser than to the number of incubees budgeted for at the beginning of the year.
Example-sub: 17 people accepted
Example-pred: 10 people budgeted for “initially”.
Note: It is hardly possible to see from the budget how many people they budgeted for. But the CEO informs via mail that it was 10 “initially” for the year 2019.
At the very start, we budgeted for 10 but moved it up to 12 after getting a better sense of applications eventually having in 13 in the program.
Definition: False.
Checklist: sub; Yes; pre; yes; ecm; Yes; s-1;
Note/Rant: Budgets are hard to find (let alone read). CE’s budget was hidden in a blog post which I got a hold of only after reaching out to them. :(
Hmm. I didn’t really expect the claim to be false based on what was said initially. In the last essay I literally said that: “EA orgs don’t seem to be able to hire the number of Entrepreneurs they want, at the end of a hiring round.”
Last year we were not management, mentoring or funding constraint and would have let in more people if we thought more people could found an extremely impactful charity.
But looking at the re-written claim this is not true. The contrast is baffling. I thought they meant one thing but I ended up with the opposite. Dang it! English-1 Agent-0.
EA orgs don’t seem to be able to hire the number of Researchers they set out to, at the end of a hiring round.
Claim: EA Orgs are not able to find the people they want while hiring Researchers.
re-write Claim: The number of people who were hired at EA Orgs in Research is less than their goal for that year.
Subject: The number of people who were hired at EA Orgs in Research,
Predicate: is less than their goal for that year.
Example-sub: In 2019 7 joined GiveWell’s research team.
Example-pred: They wanted to have 3-5 signed offer letters from new research staff as per their goals explicitly stated in their blog.
Definition: 7 !< 5. Hence false claim.
Checklist: sub; Yes; pre; Yes; ecm; Yes;
Time: Getting info from GiveWell’s budget was the hard part.
Claim: EA Orgs don’t seem to be able to hire the number of people they want while hiring for operations.
re-write Claim: The number of people who were hired at EA orgs in Operations is less than their goal for that year.
Example-sub: In 2019 3 people joined the operations team of GiveWell.
Example-pred: In 2019 GiveWell wanted to hire 1 operations associate.
Definition: 3 !< 1. False.
Checklist: sub; Yes; pre; Yes; ecm; Yes;
Note: So far we checked GiveWell and Charity Entrepreneurship and find that their goals (based on budget or explicit statements in the blogpost) are “more than met” by the supply.
EA orgs types and hiring
Claim: Longtermism organizations are able to find the people they are looking for.
re-write Claim: The number of people hired at Longtermism Orgs
MIRI is equal to or greater than their goal for that given period.
Subject: Number of people hired at MIRI in a given period,
Predicate: is equal or greater than their goal for that given period.
Example-sub: MIRI had 8 research staff in Jan 2018. MIRI has
16 research staff as of Dec 2020. But, Marcello Herreshoff seems
to have left during that time and Nate Soares seems to have taken the
“leadership” role. 16-(8-2)=10. So they did end up hiring 10 new
people.
Example-pred: 10 research people to be hired in 2 years (from 2018).
Definition: Checks out.
Checklist: sub; Yes; pre; Yes; ecm; Yes;
Disclaimer:
According to MIRI, they were up by 8 research staff as of 2019. It appears MIRI was looking at net population of staff, when I reached out to them. They have one person starting February 2020 and now another joins in May 2020. Making it 10 delayed over 6 months.
Time: >45 mins (realizing that I could look at archives)
Claim: Meta orgs are able to hire the number of people they want.
re-write Claim: The number of people hired at Meta Orgs OPP is
equal to or greater than their goal for that given year.
Subject: The number of people hired at Meta Orgs OPP in a
given year.
Predicate: is equal to or greater than their goal for that given year.
Example-sub&pred:
Unable to find more info on forecasting or budgets from OPP. And from their website it appears they didn’t have a clear idea of how many people they wanted as GRs. They keep stating that they want to hire “several” Generalist researchers in 2018. So we skip that.
OPP was looking for one Director of Operations in 2018. OPP hired Beth Jones from May 2018.
OPP seems to be looking for atleast 1 grants associates in
2018. Jan 2018 shows 2 people with that function (Grants
associate), Derek Hoph got promoted and by Nov 2018 Anya Grenier
joins leading to 2-(2-1)=1 hire as they had forecasted.
Definition: checks out.
Checklist: sub; Yes; pre; Yes; ecm; Yes;
time: 1 hr
Claim: GH&P orgs are able to hire the number of people they budgeted for.
re-write Claim: The number of people hired at GiveWell is equal to or greater than their goal for that given year.
Subject: The number of people hired at GiveWell in that given year,
Predicate: is equal or greater than their goal for that given year.
Example-sub&pred: GiveWell 2018 goals was to hire 1 head of growth and in June Ben Bateman started.
In 2019, they wanted to have 3-5 signed offer letters from new research staff. And 7 joined their research team.
Definition: checks out.
Checklist: sub; yes; pre; yes; ecm; yes;
Claim: Animal EA orgs are able to find the people they want.
re-write Claim: The number of people hired at Animal EA Orgs is equal to or greater than their goal for that given year.
Subject: The number of people hired at ACE,
Predicate: is equal to or greater than their goal for that given year.
Example-sub: 0 senior researcher were hired by the end of the year 2019 since Oct 2019 based on web archive team’s page of ACE.
Example-pred: 1 senior researcher by the end of the year 2019.
Definition: Claim is false.
Checklist: sub; Yes; pre; Yes; ecm; Yes;
Problems
Unable to extract proper forecasts of number of people to hire: https://animalcharityevaluators.org/blog/room-for-more-funding-2019/#fn2-1-26652
Is program officer hired or needed, is not clear from the blog posts above.
Whether they hired someone or not can be found easily either through web-archive, or through their budgets comparing last year and this year. But the forecasts are hard to come by.
Claim: The type of organizations (AI, GH&P and Meta) in EA doesn’t seem to affect whether the org can find a hire or not.
re-write Claim: The number of people hired at different types (AI, GH&P and Meta) of EA Orgs is equal to or greater than their hiring goal for that given year.
Subject: The number of people hired at different types (AI, GH&P and Meta) of EA Orgs in a given year.
Predicate: is equal to or greater than their hiring goal for that given year.
Example sub&pred: As we have seen above, AI org MIRI predicted a 10 people hire in 2 years and seemed to have exactly accomplished that.
Meta Org OPP wanted to hire a director of operations and one grants associate and have been successful in those endeavors by the end of the year.
GH&P org GiveWell wanted to have 3-5 signed offers for researchers in 2017 and ended up with 7. :)
Definition: checks out.
Checklist: sub; yes; pre; yes; ecm; yes;
EA orgs quality of hires
Claim: Quality of hires is good enough in EA.
re-write Claim: Most of the EA orgs’ are able to hired
Researchers (in the last 2 years), are either with greater than 3
years of experience “related to EA”, or people who studied in top
universities (based on rankings) in UK and US, or PhD’s in
Philosophy or Political sciences or Economics or Math or “relevant”
(e.g., PhD in Marine life for FWI).
Subject: Most of the hired researchers’ qualifications in EA in the last two years,
Predicate: is greater than 3 years of experience related to EA, or people who studied in top universities (based on rankings) in UK and US, or PhD’s in Philosophy or Political sciences or Economics or Math or relevant (e.g., PhD in Marine life for FWI).
Example:
| org | Name | University | PhD | NGO exp | Year | Founded | Awards |
|---|---|---|---|---|---|---|---|
| GW | Olivia | Yale | MBA. | 6m | 2018 | 1 (comm) | 6 |
| GW | Grace | Stanford | BA. Bio | 0 | 2019 | - | 2 |
| GW | Alicia | MIT | BA. Econ | 0 | 2019 | - | - |
| GW | Marinella | Oxford (17%) | PhD Phil | 1y | 2019 | - | - |
| OPP | Peter | LSE (9%) | MS. Econ | 0 | 2019 | - | - |
| OPP | Jacob | Harvard | Econ | 0 | 2018 | 3 (comp) | 6 |
| OPP | Joseph | Yale, Ox | MPhil | 0 | 2018 | - | - |
| RP | Daniel | U. Barcelona | MA. Social | >8 | 2018 | - | |
| RP | Saulius | Vilniaus | MS. CSish | 10m* | 2018 | - | - |
| RP | Neil | Oxford, EUV | PhD Social | 18m* | 2018 | - | - |
| FWI | Marco | U. Port | PhD Marine | - | 2020 | - | - |
| FWI | Jennifer | U. Freiburg | B.Sc. Environ | 3-4** | 2020 |
* internships
** did volunteering work excessively and has other research experience in university related to the field of work.
People: Olivia, Grace, Alicia, Marinella, Peter, Jacob, Joseph, Daniel, Saulius, Neil, Marco, Jennifer
Example-pred: 11/12 (most).
Definition: checks out.
Checklist: sub; yes; pre; yes; ecm; yes;
Claim: EA Orgs are happy with their recent hires.
re-write Claim: Most of the EA orgs’ are able to hired
Researchers (in the last 2 years), are either with greater than 3
years of experience “related to EA”, or people who studied in top
universities (based on rankings) in UK and US, or PhD’s in
Philosophy or Political sciences or Economics or Math or “relevant”
(e.g., PhD in Marine life for FWI).
Note: Done above.
Claim: The number of good quality people who applied are high.
re-write claim: The percentage of PHD’s or people with greater than 3 years in EA, who applied is greater than 30% of total applications.
Note: Not sure how to try this other than without accessing the data.
re-write Claim: The number of people who made it to the last round is 2x the number of people who ended up being hired.
Example-sub:
OPP had 17 people in the trial round when it hired 5 people. EAF had 4 people in the trial round while hiring 2 people. FWI had 4 people in the last round, which was a “reference check and call with finalists”, while hiring 2 people in the end.
Definition: checks out.
Checklist: sub; Yes; pre; Yes; ecm; Yes;
Time: 5 mins.
Claim: Senior staff within governments and top AI labs are struggling to find experienced and qualified AI talent to employ.
re-write Claim AI labs are not able to fill the positions which planned to the previous year.
Example-sub:
MIRI wanted to add 10 new people to their research staff in 2 years from 2018-2020.
MIRI had 8 research staff in Jan 2018. MIRI has 16 research
staff as of Dec 2020. But, Marcello Herreshoff seems to have left
during that time and Nate Soares seems to have taken the “leadership”
role. 16-(8-2)=10. So they did end up hiring 10 new people.
Definition: checks out.
Checklist: sub; Yes; pre; Yes; ecm; Yes;
Time: 5 mins.
Claim: Rethink Priorities is funding constrained.
re-write Claim: RP don’t meet their projected budget for 2019 by the end of 2018.
Example-sub:
Projected Budget for 2019: 447k USD
Projected Budget for 2019 not met by Dec 2018: 294k USD
Definition: checks out.
Checklist: sub; Yes; pre; Yes; ecm; Yes;
Time: 15 mins (coming up with the claims)
re-write Claim: RP do not increase their projected budget from 2019 to 2020.
Note: So if RP stays with the same budget in 2020 as in 2019, then we expect that donating more money could help the organization. Probably, they keep to the same budget as they don’t expect to get more money with fundraising.
Example-sub:
RP projected budget for 2019: 447k USD
RP projected budget for 2020: 1,013k USD
Definition: False, they increase their budget.
Checklist: sub; Yes; pre; Yes; ecm; Yes;
Time: 10 mins (coming up with the claims)
Where to work
Based on: Where to work
Claim: Industries cluster in certain areas.
Isn’t it enough to think of 3/4th US entertainers living in LA? or that all non-political late night shows work from in and around California?
re-write Claim: More than 50% of the industry is present in one city.
Example-sub: Three-fourths of the US entertainers live in LA.
Example-pred: LA is one city.
Definition: checks out.
Checklist: sub; Yes; pre; Yes; ecm; Yes;
Claim: It matters which city you live in.
re-write Claim: The things you value change, when you move to another region.
Example: Will probably didn’t care about “YC startup standards” while he was in London. (After he moved to the Silicon Valley,) Will found out that he was doing “merely fine” by YC standards and started to “work harder and optimize his time even further”.
Will absorbed the value that “YC standards” are to live by while he was with Y-combinator.
Definition: Checks out.
Checklist: sub; Yes; pre; Yes; ecm; Yes;
Failed? Unsure. “YC standards”, “value”!
Claim: More money at the top hubs.
re-write Claim: Salary at “great hubs” is higher than in “non-hubs”.
re-write Claim: Salary at home of headquarters of the largest revenue Investment banks’ is higher than in other places.
Example: Salary of friend in NYC in Investment Banking is about
200k$. In India was about 33k$.
New York houses the Largest Revenue Investment Bank’s Headquarters(Goldman Sachs, JP Morgan and Chase, Morgan Stanley, BofA).
Definition: checks out.
Checklist: sub; Yes; pre; Yes; ecm; Yes;
Claim: Great hubs attract top people (highly ambitious and super-productive).
re-write claims: Places that have the highest concentration from
an industry attract have highly successful people.
Subject: Type of people that places that have the highest concentration from an industry, haves.
Predicate: highly successful people.
re-write Claim: Top people from outside the hub move into the great hub.
re-write Claim: LA as the most number of US entertainers.
Note: Done already.
re-write Claim: Many >10m Youtubers not originally from LA move to LA to pursue their career.
Example: It has the likes of Logan Paul, Lily Singh, David Dobrik, Liza Koshi and many more who are not originally from LA or even Cali baby.
Logan Paul moved (with his brother Jake Paul) at a young age of 19 from Houston to LA to pursue his career of becoming a huge entertainer.
Definition: checks out.
Checklist: sub; Yes; pre; Yes; ecm; Yes;
Claim: It matters a lot the type of message the city sends you.
re-write Claim: The things you value change, when you move to another region.
Note: Done before.
Claim: Moving to a hub improves networking opportunities; improves exit opportunities.
re-write Claim: SFO is where the EA annual conferences happen.
Example-sub:
EA Global 2019 happened in San Francisco.
Definition: checks out.
Checklist: sub; Yes; pre; Yes; ecm; Yes;
Time: 5 mins.
re-write Claim: If you move to San Francisco you meet more people in the EA community.
Example-sub: Milan Griffes who worked for GiveWell (SF) (EA hub, Many EA orgs are located in that region) informs that prior to working there he was in Michigan and not familiar with the EA community at all. And that when he considered leaving GiveWell after 2 years in the HUB, three of the opportunities, including the one he accepted was enabled by his EA network. Needless to say there are parallels to this in other Great hubs such as LA as well.
Definition: checks out.
Checklist: sub; Yes; pre; Yes; ecm; Yes;
Claim: Moving to a hub increases ambitiousness,
re-write Claim: Moving to Silicon Valley makes you “work harder”.
Example: Will, probably didn’t care about “YC startup standards” while he was in London. (After he moved to the Silicon Valley,) Will found out that he was doing “merely fine” by YC standards and started to “work harder and optimize his time even further”.
Definition: Checks out?
Checklist: sub; Yes; pre; Yes; ecm; Yes;
Failed? Unsure. “YC standards”, “work harder”
Claim: Moving to a hub improves learning best practices.
re-write Claim: Playing with people who are better than you improves you.
Failed
TIO
Based on: Talent is overrated
Claim: Geniuses are made not born.
re-write Claim: People who are atop their field trained longer and harder than the ones that are not.
Example:
Atop their field: Jerry Rice is known as the greatest NFL player to have ever lived and has his total touch down, total receptions, and total receiving yards is greater than 50% compared to the second place.
How hard these people work compared to the rest:
In team workouts he was famous for his hustle; while many receivers will trot back to the quarterback after catching a pass, Rice would sprint to the end zone after each reception. He would typically continue practicing long after the rest of the team had gone home.
(His) workouts became legendary as the most demanding in the league, and other players would sometimes join Rice just to see what it was like. Some of them got sick before the day was over
Definition: checks out.
Checklist: sub; Yes; pre; Yes; ecm; Yes;
re-write Claim: Geniuses are not born.
re-write Claim: Average hours required by the “best” and the average hours required by the “rest” is similar to reach a particular grade level.
Example-sub:
In the Ericsson study:
“The researchers calculated the average hours of practice needed by
the most elite group of students to reach each grade level, and they
calculated the average hours needed by each of the other groups. There
were no statistically significant differences.”
Definition: checks out.
Checklist: sub; Yes; pre; Yes; ecm; Yes;
Time: 10mins
Claim: Hard work distinguishes the world class from the ok players.
re-write Claim: Number of hours of practice per week is greater for people who were the top class (who would win most competitions) w.r.t to people who would win (lesser competitions).
Example:
Ericsson study shows that the “best people” practiced for 24 hrs per week and the “not so best people” practiced for 9hrs a week. (The classification of “best” and “not so best” is done by the book TIO based on the number of competition won).
Definition: Checks out.
Checklist: sub; Yes; pre; Yes; ecm; Yes;
Claim: Experience does not distinguish the “world class” from the “ok” players.
re-write Claim: The “best” compared to the “good” were playing for a similar number of years before becoming “musicians”.
Example: In the Ericsson study, all age groups started by around 8 and decided to become musicians by 15, yet they were distinguished into 3 different groups basked on skill level.
Definition: checks out.
Checklist: sub; Yes; pre; Yes; ecm; Yes;
Time: 15 mins.
Claim: Luck does not distinguish the world class from the people who work hard.
re-write Claim: Number of hours of practice per week is greater for people who were the top class (who would win most competitions) w.r.t to people who would win (lesser competitions).
Example:
Ericsson study shows that the “best people” practiced for 24 hrs per week and the “not so best people” practiced for 9hrs a week. (The classification of “best” and “not so best” is done by the book TIO based on the number of competition won).
24>9.
Definition: Checks out.
Checklist: sub; Yes; pre; Yes; ecm; Yes;
Claim: Mozart was extremely smart. No one compares to his level.
re-write Claim: There is no one like Mozart today.
re-write Claim: Number of years of study before performing publicly w.r.t to average students is greater for Mozart than 20th century prodigies.
Example-sub:
-
Average student: say 6 years before performing
-
Mozart: 6/1.3 = 4.6 years
-
20th century prodigies: 6/5 = 1.2 years
-
The above is based on Precocity index.
-
Source: pg. 27 TIO
Definition: False, does not check out.
Checklist: sub; Yes; pre; Yes; ecm; Yes;
Time: 15 mins
Claim: Talent doesn’t exist.
re-write Claim: Average hours required by the “best” and the average hours required by the “rest” is similar to reach a particular grade level.
Example-sub:
In the Ericsson study:
“The researchers calculated the average hours of practice needed by
the most elite group of students to reach each grade level, and they
calculated the average hours needed by each of the other groups. There
were no statistically significant differences.”
Definition: checks out.
Checklist: sub; Yes; pre; Yes; ecm; Yes;
Time: 2mins (copied from past claims)
Claim: There is nothing called in born talent for tiger.
re-write Claim: Number of hours of practice before Tiger got into pro-golf compared to others was statistically not significant.
Failed Don’t have these numbers.
Claim: Memory distinguishes the world class from the people who work hard.
re-write Claim: How much World class Chess players can remember vs how much non-chess players can remember is different only when it comes to Chess.
Example-sub:
“Consider a study in which highly skilled chess players as well as non- players were shown chessboards with twenty to twenty-five pieces set up as they were in actual games; the research subjects were shown the boards only briefly—five to ten seconds—and then asked to recall the positions of the pieces. The results were what you’d expect: The chess masters could typically recall the position of every piece, while the non- players could place only four or five pieces.”
“Then the researchers repeated the procedure, this time with pieces positioned not as in actual games but randomly. The non players again could place only four or five 46 How Smart Do You Have to Be? pieces. But the masters, who had been studying chessboards for most of their lives, did scarcely better, placing only six or seven pieces.”
Definition: checks out.
Checklist: sub; Yes; pre; Yes; ecm; Yes;
Time: 10 mins
Randomista development
Based on: Highest Karma EA forum post
We define randomista development (RD) as an approach to development economics which investigates, evaluates and recommends only interventions which can be tested by randomized controlled trials (RCTs).
RD can take low-risk or more “hits-based” forms. Effective altruists have especially focused on the low-risk form of RD: specifically, directly funding interventions that have been tested by RCTs, such as malaria bednet distributions and cash transfers. However, even within direct funding of such programmes, there is significant variation in the probability of success. For example, GiveWell thinks that deworming is a high risk/high-reward bet with a significant chance of having small effect but some chance of having a large effect. Other GiveWell recommended programmes offer a much more certain probability of impact.
Note: There is some fundamental confusion regarding the definition of “RD”. “RD is defined as an approach to development economics which investigates, evaluates and recommends only interventions which “can be tested” by randomized controlled trials (RCTs)”. If you say “CAN be tested” then I don’t know how to go about testing it. I don’t know what distinguishes something as “can be tested by RD” and “cannot be…”. If you say “Is tested by RCTs” instead, then both GiveWell and OPP don’t qualify as “RD”, as some of the interventions that they offer grants to, do not have RCTs for them e.g., “CPSP”. Having said that, the author of the blog post refers to GiveWell and Open Philanthropy Project (OPP) in the context of “RD” multiple times, so in many places I just substitute “RD” with GiveWell or OPP.
So basically the claim is modified as shown: “Direct funding of
interventions that can be have been tested by RCTs.”
Claim: Direct funding of interventions that have been tested by RCTs can be low-risk.
Claim: RD can take “low-risk forms”.
re-write Claim: Recommending interventions which are based on RCTs, carries high probability of success in some cases.
re-write Claim: Recommended interventions which are based on RCTs, carries high (>10%) estimated adjustment factor (e.g., for accounting for the mismatch between RCTs and current interventions).
Example-sub: GiveWell recommends Malaria Bednet Distributions intervention. The multiplying factor is estimated to be 24%.
| Intervention | Variable | % | based on row |
|---|---|---|---|
| MBD(5+ age) | (based on) total number of deaths averted | 24% | 80 |
| MBD | Downside adjustments | 80% | 191 |
| MBD | Exclusion effects | 126% | 214 |
| MBD | Total product | 24% | - |
2019 CE analysis of GiveWell with rows to calculate some aggregate %
Definition: 24% is >10%. Checks out.
Checklist: sub; Yes; pre; Yes; ecm; Yes;
Time: 4 hrs (finding evidence, understanding the CE estimates, and finally leaving it at this)
Claim: Directly funding of interventions that have been tested by RCTs can also be high-risk.
Claim: RD can take “hits-based” forms.
re-write Claim: Recommending interventions which are based on RCTs, carries high-risk in some cases.
re-write Claim: Recommended interventions which are based on RCTs, carries low (<10%) estimated adjustment factor (e.g., for accounting for the mismatch between RCTs and current interventions).
Example-sub: GiveWell recommends Deworming interventions. The adjustment factor is estimated to be 1% in their blog post. We use the same method as above to come to the 1%.
| Intervention | Variable | % | based on row |
|---|---|---|---|
| DTW | Aggregate adjustment | 0.97% | 46 |
| DTW | Downside adjustments | 92% | 184 |
| DTW | Exclusion effects | 121% | 204 |
| DTW | Total product | 1% | - |
2019 CE analysis of GiveWell with rows to calculate some aggregate %
Definition: checks out.
Checklist: sub; Yes; pre; Yes; ecm; Yes;
Time: 4 hrs (In total I spent 2x 4hrs trying to understand the last two claims and getting to some uniform way of making the example.)
Note: Understanding what GiveWell meant with low risk and in the end writing it out was so hard. Finding info also took equal time I think. The author of the blog-post just says it is low risk. But in actuality (I checked with GiveWell too) they are talking about an adjustment factor to account for things like “mismatch between RCTs and current interventions”. “High risk” is such a misnomer here both in GiveWell’s website and in the blog post used for this excercise.
Claim: EAs have especially focused on directly funding interventions that have been tested by RCTs.
re-write Claim: EA Orgs’ all recommended interventions are based on atleast one RCT that is available on this topic.
Subject: The number of RCTs based on which the EA Orgs recommend each of their interventions,
Predicate: is >= 1 (per intervention recommended)
Example-sub:
-
GiveWell recommends Malaria consortium which does SMC. Apparently there are 7 RCTs that provide “strong evidence” that SMC substantially reduces.
-
GiveWell recommends AMF which provides funding for LLINs. They use a couple of RCTs, for example, one on comparing mortality rates in children that received nets from birth to 6 months.
-
GiveWell recommends Helen Keller’s Vitamin A supplementation program. This is based on a couple of RCTs as well.
Definition: Of the first 3 recommended interventions we looked at it appears that they all use more than 1 RCT.
Checklist: sub; Yes; pre; Yes; ecm; Yes;
Claim: However, even with direct funding programmes there is significant variation in the probability of success.
re-write Claim: There is a significant variation (>10%) in the estimated adjustment factor (e.g., attributed to the deviation of the RCTs from the current day interventions) across GiveWell recommended interventions.
Example-sub:
| Intervention | Variable | Value | |
|---|---|---|---|
| MBD | Total product | 24% | - |
| DTW | Total product | 1% | - |
Definition: Yes “significant” variation of >10%.
Checklist: sub; Yes; pre; Yes; ecm; Yes;
Claim: Other GiveWell recommended programmes offer a “much more certain” probability of impact.
re-write Claim: The estimated adjustment factor , is high (>10%) for other interventions.
Subject: The estimated multiplying factor (that is responsible for the reduction in lives saved as a result of the mismatch between current intervention and RCTs used).
Predicate: are much greater than 1%.
Example-sub:
GiveWell estimates the CE from which the factors are extracted.
| Variable | % | based on row | |
|---|---|---|---|
| MBD(5+ age) | (based on) total number of deaths averted | 24% | 80 |
| MBD | Downside adjustments | 80% | 191 |
| MBD | Exclusion effects | 126% | 214 |
| MBD | Total product | 24% | - |
| DTW | Aggregate adjustment | 0.97% | 46 |
| DTW | Downside adjustments | 92% | 184 |
| DTW | Exclusion effects | 121% | 204 |
| DTW | Total product | 1% | - |
| VAS | Aggregate based on cell 40 & cell34 | 10% | 40&34 |
| VAS | Downside adjustments | 76% | 129 |
| VAS | Exclusion effects | 156% | 146 |
| VAS | Total product | 12.5% | - |
2019 CE analysis of GiveWell with rows to calculate some aggregate %
Definition: Checks out looking at one other intervention.
Checklist: sub; Yes; pre; Yes; ecm; Yes;
More clearly hits-based forms of RD are possible. GiveWell has done various forms of more hits-based giving, including for example its support for the Center for Suicide Prevention, which advocates for policy change at the national level in India and Nepal. Co-Impact, a collaborative philanthropy group, is advocating for national scale-up of the RCT-supported education programme Teaching at the Right Level across Africa. By this definition, RD also includes advocacy and scale-up of scientific research that can be tested by RCTs, such as mosquito gene drives, researching vaccines or antibiotics, or the agricultural research that led to the Green Revolution.[1]
Definition: Hits based giving is looking only at CE estimates and not at probability of success (adjustment factors) which could be quite high.
Claim: Hits-based forms of RD are possible.
re-write Claim: Recommended interventions having low (1-2%)
adjustment factor (e.g., for accounting for the mismatch between RCTs
and current interventions), but High cost-effectiveness ( x-times
better than cash transfers)based on CE alone, happens with
GiveWell.
Example-sub:
GiveWell recommends Deworming The World despite its low multiplier of 1% and CE value being high (67 times better than Cast transfers).
Definition: checks out.
Checklist: sub; Yes; pre; Yes; ecm; Yes;
Claim: Support for Center for Pesticide Suicide prevention is hits-based by GiveWell.
re-write Claim: CPSP has a low adjustments (<=10%) (e.g., for accounting for the mismatch between RCTs and current interventions) and a high CE (greater than Cash Cash Transfers).
Example-sub:
CSPS is 9x cost effective than cash transfers. Multiplier for India is estimated to be 10% and nepal to be 60%.
Definition: checks out.
Checklist: sub; Yes; pre; Yes; ecm; Yes;
Claim: RD also includes advocacy and scale up of scientific research that can be tested by RCTs.
re-write Claim: EA orgs are also proponents of advocacy and
scale-up of scientific research that can be tested by RCTs.
re-write Claim: GiveWell grants money to interventions which attempt to change policy in governments.
Example: GiveWell grants 1m$ to CPSP to “start collecting data
on pesticide suicides in Nepal and India with the aim of assisting
governments in enacting bans on the most lethal pesticides currently
used in suicide attempts”—GiveWell about CPSP.
Definition: checks out.
Checklist: sub; Yes; pre; Yes; ecm; Yes;
re-write Claim: GiveWell recommends interventions which currently don’t have RCTs to back up but does have some other empirical evidence.
Subject: What GiveWell recommends.
Predicate: interventions that do not have RCTs currently.
Example-sub: GiveWell recommends CPSP, which currently has two observational time series analyses from Sri Lanka and NO RCTs on the subject.
Definition: checks out.
Checklist: sub; Yes; pre; Yes; ecm; Yes;
re-write Claim: RD also includes advocacy that can be tested by RCTs.
re-write Claim: CPSP (previous example) can be tested by RCTs.
Note: Testing one aspect of RCTs atleast in the following.
re-write Claim: CPSP intervention can be Randomized within a country.
Example-sub:
By selecting many regions and assigning each region randomly to “treatment” and “control”, it can be randomized.
Definition: checks out?
Failed? Not an example? Can you even test “can”?
Checklist: sub; Yes; pre; Yes; ecm; Yes;
Time: 15 mins
Claim: RD includes scale-up of scientific research.
re-write Claim: EA orgs recommend “scale-up of scientific research”.
re-write Claim: GiveWell recommends organizations which do
“scaling up of scientific research” such as mosquito gene drives,
researching vaccines or antibiotics.
Example-sub: GiveWell lists its priority programs here. none of “scientific research” is mentioned here.
Definition: Doesn’t check out.
Checklist: False; sub; Yes; pre; Yes; ecm; Yes;
re-write Claim: Co-impact recommends organizations which do
“scaling up of scientific research” such as mosquito gene drives,
researching vaccines or antibiotics.
Example-sub: I can’t find in their systems grants or their design grants anything related to promoting research of vaccines or antibiotics or “modifying genes of mosquitoes” or similar.
They seem to be funding interventions that aim to improve healthcare in Liberia etc…
Definition: Doesn’t check out.
Checklist: False; sub; Yes; pre; Yes; ecm; Yes;
Global poverty remains a popular cause area among people interested in EA.[2] EA has especially focused on directly funding RCT-backed interventions. GiveWell moved
$161m to RCT-backed charities in 2018.[3] The Effective Altruism Global Health and Development Fund has disbursed most of its funds to charities that directly implement RCT-backed interventions.
Claim: Global poverty remains a popular cause area among people interested in EA.
re-write Claim: Many GiveWell’s top recommended charities focus on
global reducing death.
Example-sub: Out of the 9 top recommended charities by GiveWell 8 of them focus on health. For example, Malaria consortium focuses on reducing the risk of death due to Malaria in Africa and Asia.
Definition: checks out.
Checklist: sub; Yes; pre; Yes; ecm; Yes;
Time: 6mins
re-write Claim: Many GiveWell’s top recommended charities focus
on global reducing poverty.
Example-sub: Out of 9 top recommended charities only 1 focuses on reducing poverty, called GiveDirectly.
Definition: checks out.
Checklist: sub; Yes; pre; Yes; ecm; Yes;
Time: 1 mins
Failed?: I guess that the claims are not narrow enough. “Reducing Poverty”.
Claim: EA has especially focused on directly funding RCT-backed interventions.
re-write Claim: GiveWell has provided grants to RCT-backed interventions.
re-write Claim: Most GiveWell’s top charities’ interventions are supported by >=1 number of RCTs.
Example-sub:
-
Malaria Consortium: SMC: 7 RCT
-
Helen Keller’s Vitamin A supplementation program: VAS: >1 RCT
-
Deworming the world: Deworming: >5 RCT
-
SCI foundation: Deworming: >5 RCT
-
Sightsavers work on Deworming: Deworming: >5 RCT
-
the End fund: Deworming: >5 RCT
-
GiveDirectly: Cash Transfers: atleast 1 RCTs
Definition: Checks out that 8/8 are “RCT-backed”.
Checklist: sub; Yes; pre; Yes; ecm; Yes;
Time: 30 mins
Failed? “supported by RCTs?” How would one make this concrete? I feel this whole “RCT-backed” thing is vague. All I am trying to say is I look at GiveWell posts and check if there are any RCTs in it. How “good quality” they are? I don’t know.
Claim: GiveWell moved $161m to “RCT-backed” charities in 2019.
re-write Claim: GiveWell moved 161m USD in total in 2019.
Example-sub: 2019 impact review by GiveWell shows 161m$ in
money moved.
Definition: checks out.
Checklist: sub; Yes; pre; Yes; ecm; Yes;
Time: 6mins
Claim: The Effective Altruism Global Health and Development Fund has disbursed most of its funds to charities that directly implement RCT-backed interventions.
re-write Claim: The Effective Altruism Global Health and
Development Fund grants disbursed over 5m$ out of ~6m$ to
RCT-cited interventions.
Example-sub:
Total grants disbursed to date: ~6m$
Total grants disbursed to following interventions: ~5m$
Fortify Health: atleast 1 RCT
Malaria consortium: SMC: 7 RCT
J-PAL’s Innovation in Government Initiative: atleast 1 RCT
Schistosomiasis Control Initiative: Deworming: >5 RCT
Definition: checks out.
Checklist: sub; Yes; pre; Yes; ecm; Yes;
Time: 30mins
re-write Claim:
Recently, GiveWell announced that they will expand their research beyond RD to include difficult-to-evaluate interventions. This could include economic growth, though their initial focus is on improving health policy. Nonetheless, as things stand at the moment, most of the EA money in global development focuses on directly funding interventions that can be tested by RCTs. Almost all EAs interested in global development we have met at events like EAG seem focused on directly funding, or working for, organizations implementing interventions that can be tested by RCTs.
Claim: GiveWell announced that they will expand their research beyond RD to include difficult-to-evaluate interventions.
Note: GiveWell says they are going to go “beyond empirical research, in their announcement”. “This includes more comprehensively reviewing direct interventions in sectors where impacts are more difficult to measure, investigating opportunities to influence government policy, as well as other areas.”. I don’t think there is any point in going further than this ATM as this is about their future and it’s only been 6 months. Are they talking about even smaller “adjustment factors” (as seen in the beginning)? That would be one of the ways how we can measure if the organizations are “difficult-to-evaluate” interventions.
Claim: GiveWell’s initial focus is to focus on improving public policy.
re-write Claim: GiveWell wants to focus on Global health alone and not on economic growth.
re-write Claim: GiveWell is not planning to investigate interventions that are other than GH&P.
re-write Claim: Interventions GiveWell plans to investigate are only about GH&P.
Example-sub: Charter cities; infrastructure programs, Building State Capability are all part of the things they want to explore.
As per Feb 2019 they would like to investigate the above.
Definition: These are not only about GH&P. Umm but some people would argue that everything in the end is about GH&P. This claim and example is a mistake. or atleast GH&P is ill-defined.
Failed
Checklist: sub; Yes; pre; Yes; ecm; Yes;
Time: 15mins
Claim: Most of the EA money in global development focuses on “directly funding interventions” (that can be tested by RCTs).
re-write Claim: Effective Altruism Global Health and Development Fund grants disbursed most of the donations to RCT-cited interventions.
Example-sub: ~5m$ out of ~6m$ sent to RCT-cited
interventions.
Total grants disbursed to date: ~6m$
Total grants disbursed to following interventions: ~5m$
Fortify Health: atleast 1 RCT
Malaria consortium: SMC: 7 RCT
J-PAL’s Innovation in Government Initiative: atleast 1 RCT
Schistosomiasis Control Initiative: Deworming: >5 RCT
Definition: checks out.
Checklist: sub; Yes; pre; Yes; ecm; Yes;
Time: 5mins
re-write Claim: The Effective Altruism Global Health and Development Fund grants disbursed 80% of the donations to interventions which involve, people getting objects such as bednets or tablets to prevent diseases or cash transfers to their bank accounts.
Example-sub:
“Most of the donations” –> 3m of the 6m disbursed, was to, Malaria Consortium and Schistosomiasis Control Initiative.
50% to “direct interventions”. Fortify Health and J-Pal’s “Innovations in the Government” which received another 2m total, are interventions where the people don’t directly receive stuff.
Definition: Does not check out to be 80%.
Checklist: sub; Yes; pre; Yes; ecm; Yes;
Time: 20 mins (“directly funding interventions” was hard to test.)
Note: The first time I did this CLAIM, I completely missed “directly funding interventions”. Damn. It’s only when I was reading it the second time that I found this unclear.
Claim: Almost all “EAs” interested in “global development” we have met at events like EAG seem “focused on directly funding interventions” that can be “tested by RCTs”.
Note: personal evidence can’t be tested.
re-write Claim: 90% of all the people who saw and took the “EA survey on the EA forum”, donated to RCT-backed interventions and not “AI/meta causes”.
Note: I know you are going to say “AI/meta causes? WTF!” How else do I play this?
Example-sub:
EAs who donated according to survey: 1070
EAs who donated to RCT backed interventions: 623 including only GiveWell and GiveWell Top charities (such as AMF, GiveDirectly GiveWell, SCI, DTW).
623/1070=58%.
Definition: Does not check out.
Checklist: sub; Yes; pre; Yes; ecm; Yes;
Time: 60 mins (very hard, trying to tackle all phrases in courts, and am certain I still sucked)
Failed?
Claim: Almost all EAs interested in global development we have met at events like EAG seem focused on working for, organizations implementing interventions that can be tested by RCTs.
re-write Claim: Most EAs donating to “global development” would like to work in organizations implementing “RCT-backed” interventions.
This seems very hard to verify as I don’t have the data atm and it will be time consuming to extract such info. So, I skip for now.
I tried looking at Career and Skills survey and Cause prioritization survey but didn’t get far. I think I need data like, where people would actually like to work such as AMF, GiveWell etc… only then can I go that far.
Failed?
Time: 15mins
We too used to support direct funding of interventions that can be tested by RCTs, but now believe it is suboptimal. We will argue that research and advocacy for growth-friendly economic policies can often be orders of magnitude more cost-effective than direct funding of evidence-based interventions. The case against hits-based RD is less clear and we leave that to future work.
Claim: Funding of interventions that are tested by RCTs is suboptimal.
Note: Didn’t come as far in the blogpost so as to be able to answer it.
Claim: “Research and advocacy” for “growth-friendly economic policies” can often be “orders of magnitude more cost-effective” than “direct funding of evidence-based interventions”.
Note: Didn’t get as far in the blogpost to be able to answer it.
The ideas here rely heavily on work by Lant Pritchett of the Blavatnik School of Government in Oxford.[4] However, within economics there is considerable support for similar views (see Appendix 1).
Claim: Within Economics there is considerable support for similar views.
Note: Didn’t get as far in the blogpost to be able to answer it.
Randomista 3.0
In this section, we set out three arguments for the proposition that research and advocacy for growth is more cost-effective than directly funding interventions tested by RCTs. However, since economic growth is not all that matters, this does not necessarily mean that advocacy for growth is the best way to increase human welfare. To reiterate: we focus on economic growth here, and aim to show that research and advocacy for growth is better than randomista development. However, there may be other ways to cost-effectively increase human welfare outside of the constraints of RD (e.g. through decreasing inequality or improving the provision of public goods that are not properly reflected in GDP).
Claim: Research and advocacy for growth is more cost-effective than directly funding interventions tested by RCTs.
Claim: “Economic growth” is not the best way to increase “human welfare”.
Claim: Research and advocacy for growth is better than randomista development.
Claim: There may be other ways to cost-effectively increase human welfare outside of the constraints of RD.
Note: The above are dealt with through this excercise.
Econ growth
Claim: Economic growth explains a substantial fraction of the variance in human welfare today.
re-write Claim: GDP per capita correlates with “expanded welfare metric”.
Note: Answered below.
In this section, we discuss the relationship between income per head and different objective and subjective measures of welfare.
Claim: we discuss the relationship between income per head and different objective and subjective measures of welfare.
Note: Answered below.
Income per head and broad measures of welfare (title)
Today, there is significant variation in income per head across the world
Claim: There is significant variation in income per head across the world.
re-write Claim: There is significant variation in GDP per capita across the world.
re-write Claim: There is variation in orders of magnitude in GDP per capita across the world.
Example-sub: US GDP 2016 is 53000$. India’s is at 5000$ (one
order smaller than US). Democratic republic of Congo is at 836$ (2
orders smaller than US).
Definition: checks out.
Checklist: sub; Yes; pre; Yes; ecm; Yes;
Time: 15mins
Claim: If “markets function reasonably well” and people are “broadly rational”, then “richer people” will buy more goods which have a “substantial private good element”.
re-write Claim: In places with GDP per capita >50k USD, then
richer people will buy more goods which have a substantial private
good element.
re-write Claim: The more money you earn the more people tend to
spend on food and shelter in countries like Netherlands.
Example-sub:
When I earned 42k I spent 5760 on rent. When I earned 60k I spent 9600 euros on rent.
Definition: checks out.
Checklist: sub; Yes; pre; Yes; ecm; Yes; HARD still.
Time: 90mins
Claim: Large cross-national differences in income per head cause large differences in human welfare due to differential consumption of private goods.
re-write Claim: “Large” cross-national differences in GDP per
capita predicts differences in human welfare due to differential
consumption of private goods.
Note: Causation is hard to establish. So we skip it.
Example-sub:
Consider Niger and Portugal. All values are w.r.t that of the US.
| welfare metric | GDP per person | |
|---|---|---|
| Niger | ~1/64 | ~1/64 |
| Portugal | ~1/2 | ~1/2 |
Differences in GDP per capita predicts differences in welfare metric.
Definition: checks out.
Checklist: sub; Yes; pre; Yes; ecm; Yes;
Time: 30mins
Claim: Charity is public good.
re-write Claim: Effects of donating to charity is non-rivalrous and non-excludable.
Example-sub: Increasing the total utility of the world by sending 4k USD to AMF.
Definition: This total utility is non-excludable, as you cannot stop someone from experiencing the joy of increasing the total utility of the world. This is also non-rivalrous as if one person feels happy doesn’t mean other person can’t feel happy as well.
Checklist: sub; Yes; pre; Yes; ecm; Yes; Difficulty level: private good.
Time: 15mins
This does not mean that GDP is all that matters. The metric of GDP per capita misses some crucial contributors to human welfare, including:
Public goods: Increasing income per head reliably increases consumption of private goods. However, it might not necessarily increase public goods, such as public health interventions, clean air, public safety, electricity grids, sanitation, and so on.
Consumption: High levels of investment increase GDP but also constitute foregone consumption, which involves a loss of welfare that is not reflected in GDP. Leisure: High hours worked per capita deliver higher GDP but also constitute foregone leisure time, which involves a loss of welfare that is not reflected in GDP
Claim: The metric of GDP per capita misses some crucial contributors to human welfare.
re-write Claim: Increase in GDP per capita does not mean there is an increase in production of public goods.
re-write Claim: Increase in GDP per capita does not mean there is an increase in government spending on healthcare per capita.
re-write Claim: Increase in GDP per capita and increase in government spending on healthcare per capita do not happen at the same time.
Example-sub:
| India | 1995 | 2014 | Unit | comment | |
|---|---|---|---|---|---|
| 1. | GDP per capita | 1565 | 5312 | USD/person | |
| 2. | Population | 0.936 | 1.3 | billion | |
| 3. | GDP | 1.4T | 6.9T | USD | 1x2 |
| 4. | healthcare spending | 1% | 1.4% | % of GDP | |
| 5. | healthcare spending per capita | 14.9 | 74.3 | USD | 4x3/2 |
-
Percentage increase in GDP per capita: 239%
-
Percentage increase in healthcare spending per capita: 398%
Definition: As far as India is concerned it appears that Increase in GDP per capita and increase in healthcare spending happen at the same time.
Checklist: False; sub; Yes; pre; Yes; ecm; Yes;
Time: 1.5hrs
Claim: Public health intervention is a public good.
re-write Claim: The value of Public health intervention is non-rivalrous and non-excludable.
Example-sub: AMF does LLIN interventions in developing countries
saving roughly 12500 lives in 2016 alone (50mn $ with each life
costing 4k $). For this AMF spent 50m USD.
Value of a LLIN interventions: 12500 x 7m$= 87bn$
Definition: This total utility is non-excludable, as you cannot stop someone from experiencing the joy of increasing the total utility of the world by 87bn. This is also non-rivalrous as if one person feels happy doesn’t mean other person can’t feel happy as well.
Checklist: sub; Yes; pre; Yes; ecm; Yes;
Time: 20min
Consumption: High levels of investment increase GDP but also constitute foregone consumption, which involves a loss of welfare that is not reflected in GDP.
Claim: If GDP and investment increases then consumption decreases.
re-write Claim: Foreign investment increases, GDP increases but electricity consumption decreases
re-write Claim: Foreign investment decreases, GDP decreases but electricity consumption increases
Example-sub: Libya has decrease in GDP, decrease in investment but still increases in consumption.
| Libya | 2007 | 2014 |
|---|---|---|
| Foreign direct investment | 5% | -0.19% |
| per capita Electricity consumption | 1857kWh | 3795kWh |
| GDP per capita | 27953 | 9736 |
Foreign direct investment as a % share of GDP
Electricity consumption per capita
Definition: Checks out.
Checklist: sub; Yes; pre; Yes; ecm; Yes;
Time: 2hrs
Leisure: High hours worked per capita deliver higher GDP but also constitute foregone leisure time, which involves a loss of welfare that is not reflected in GDP
re-write Claim: Higher hours of work per capita implies there is going to be higher GDP, for countries with GDP per capita (from 30k to 40k).
Example-sub:
From 1980 to 2000,
| Abs. change in hr | Abs. change in GDP pp | GDP per capita Yr2000 | |
|---|---|---|---|
| Australia | +1.35 h | +13k | 39k |
| Belgium | -1.6 h | +10k | 34k |
| Canada | +0.9 h | +10k | 38k |
| Spain | -4.55 h | +13k | 29k |
| Netherlands | -6.5 h | +13k | 40k |
We see cases where there is decrease in ‘abs. change in hrs per week’ but still the GDP per capita increases.
Definition: Doesn’t check out.
Checklist: False; sub; Yes; pre; Yes; ecm; Yes;
Time: 25mins
Inequality: Individuals get diminishing marginal utility from income, so income gains to the better-off should be valued less than income gains to the worse-off. Thus, holding income per capita and everything else equal, societies with a more equal income distribution must have greater welfare per person. In addition, income and other resources might be positional goods - perceiving others to be richer might be another mechanism by which inequality might lead to lower overall welfare. This is a difference in welfare that is not captured by GDP.
Note: Another insanely hard paragraph.
Claim: Individuals get diminishing marginal utility from income.
re-write Claim: Marginal utility of a good or service declines as its supply increases.
Note: “Marginal” throwing me off. I feel better once I remove that word Spent 1 hr on understanding how to actually answer this claim.
re-write Claim: Increase in utility of a good, decreases, as supply increases.
re-write Claim: Increase in “utility” of a good diminishes, as “supply increases”
re-write Claim: Increase Difference in “amount you are willing
to pay” for a good diminishes, with every additional good at a given
time.
Example-sub:
For Pizzas delivered at 6 o’ clock today,
| pizza number | Willing to pay (WTP)_ | delta in WTP | Comment |
|---|---|---|---|
| 1 | 15 Euros | N/A | I will eat it |
| 2 | 7 Euros | -8 Euros | I can freeze it |
| 3 | 3 Euros | -4 Euros | Will give it to friend |
| 4-10 | 0 euros | -3 Euros | no space anywhere |
With the first pizza I am willing to pay 15 euros. If there is an offer of some sort to get extra pizza I will consider it, so that I can save it for future in my freezer. If they are giving me 7 more pizzas for 7 euros, I couldn’t care less as I can’t eat it or store it. This often happens when I buy from Subway… When there is an offer.
Definition: Checks out.
Checklist: sub; Yes; pre; Yes; ecm; Yes; difficulty level: “private goods”
Time: 30 mins. (first time 30 mins and failed)
Note: I am happy that when I come back to this claim after going one round over 200 claims I am able to answer it atleast.
Claim: Individuals get diminishing marginal utility from income
re-write Claim: “Utility” from (additional income)[2], declines as (income increases)[3].
Note: what is this utility, and how do we measure it? Happiness quotient? Money spent on outside food? I think that is the main problem.
Note: the value of 2 dollars when I didn’t have a job was really high as I would refuse to spend it on anything. Going for a 10 euro lunch was blasphemy and spending 20 euros for dinner was outrageous.
re-write Claim: Amount of money you spend per month for food and shelter, increases with increase in salary.
Example-sub:
When I earned 0k, My total expenses for rent, food and drinks was 600-800 euros a month.
When I earned 42k, I spent 900-1000 euros on expenses.
When I earn 60k, I spent about 1400-1600 Euros on expenses.
Definition: checks out.
Checklist: sub; Yes; pre; Yes; ecm; Yes; “difficulty level”: proverb
Failed
Time: 120mins
Claim: The more you use a good or service, the less satisfied you will be with each successive use or consumption.
re-write Claim: You will be less satisfied with every successive consumption of a good.
Example-sub:
| Number of bites | self-reported Satisfaction (SRS) |
|---|---|
| 1/2 a pizza | 10 on 10 |
| 2nd half | 7 on 10 |
| 2nd pizza | -1 on 10 |
Personally,
-
Eating the first slice of pizza –> utility high (eating it really fast).
-
After half of the pizza –> I start to wonder why I buy Pizza nowadays.
-
Eating the last slice of pizza –> Utility low (trying to finish it so that it doesn’t “go to waste”).
-
Looking at another Pizza right after –> Tapping out.
Definition: checks out.
Checklist: sub; Yes; pre; Yes; ecm; Yes;
Time: 15 mins
Claim: Difference in inequality in not captured by GDP.
re-write Claim: Inequality is not captured in GDP.
re-write Claim: Gini index is not strongly (0.7) correlated with GDP per capita across different countries.
Example-sub:
Correlation: 0.14 (Gini index vs GDP per capita as of 2000) (-ve).
Definition: checks out.
Checklist: sub; Yes; pre; Yes; ecm; Yes;
Time: 30mins
re-write Claim: Gini index increases as GDP per capita increases for a given country over time.
Example-sub:
| Spain | 2004 | 2011 |
|---|---|---|
| Gini index | 33.3% | 35.7% |
| GDP per capita | 28000 | 31000 |
| US | 1979 | 2013 |
|---|---|---|
| Gini index (Market income) | 43% | 53% |
| Gini index (Disposable income) | 31% | 38% |
| GDP per capita | 30k | 53k |
Definition: checks out. Inequality increases with time for the same country despite growth in GDP.
Checklist: sub; Yes; pre; Yes; ecm; Yes;
Time: 30mins
Claim: Thus, Holding income per capita and everything else
equal, societies with a more equal income distribution must have
greater welfare per person.
re-write Claim: Across countries with same GDP per capita,
countries with lower GINI index (>4%) have higher “welfare per person”,
HDI.
re-write Claim: Across countries with same GDP per capita, countries with lowest GINI index have highest HDI.
Example-sub:
2013 data Gini Index per country. Here GDP per capita is “adjusted for price differences between countries”. HDI graph here.
| Country | GINI index | GDP per capita | HDI |
|---|---|---|---|
| Finland | 27 | 37k | 0.91 |
| Japan | 32.1 | 37k | 0.9 |
| UK | 32.5 | 37k | 0.92 |
| France | 33.1 | 37k | 0.89 |
| Sweden | 27.3 | 41k | 0.91 |
| Denmark | 29 | 43k | 0.93 |
| Germany | 30.1 | 43k | 0.93 |
| Canada | 33.7 | 43k | 0.91 |
| Netherlands | 27 | 48k | 0.92 |
| Ireland | 32.52 | 49k | 0.91 |
| US | 41 | 51.5k | 0.92 |
Definition: Doesn’t check out, as UK still has higher HDI than Finland.
Checklist: False; sub; Yes; pre; Yes; ecm; Yes;
Time: 30mins
Claim: Income and other resources might be positional goods.
Note: Skipped as it seems to be too vague (too many English words that need to be converted into testable phrases, e.g., “material prosperity”, “limited supply”, “relatively more expensive”).
Definition: goods which are in limited supply and which become more sought after and relatively more expensive as material prosperity increases.
Social connection: Social connection is not represented in GDP statistics but is a major determinant of human welfare.
Claim: Social connection is not represented in GDP but is a major determinant of human welfare.
Note: No idea what he’s talking about. Skip.
Health: A country can have higher income per head than another, but the lives of its citizens could be worse if they die earlier or suffer greater morbidity.
Claim: A country can have higher income per head than another, but the lives of its citizens could be worse if they die earlier or suffer greater morbidity.
re-write Claim: Higher GDPPC does not imply higher life expectancy.
Example-sub:
2015 Life Expectancy vs GDP per capita
| GDP per capita | Life expectancy | |
|---|---|---|
| Cuba | 7.8k USD | 78.56 |
| US | 52k USD | 78.91 |
| Japan | 36k USD | 83.88 |
Definition: checks out.
Checklist: sub; Yes; pre; Yes; ecm; Yes;
Time: 10 mins
It is therefore interesting to explore how well GDP per capita correlates with more holistic measures of welfare that try to account for these other determinants. There have been numerous attempts to build a more holistic measure of welfare than GDP per capita. In a 2016 paper, Jones and Klenow used measures of consumption, leisure, inequality, and mortality, to create a consumption-equivalent welfare measure that allows comparisons across time for a given country, as well as across countries.[6]
Claim: It is “interesting” to explore how well GDP per capita correlates with more holistic measures of welfare that try to account for these other determinants.
Note: You can’t test this? because of “interesting”. It’s along the lines of “it makes sense to do X”?
re-write Claim: GDP strongly correlates with “more holistic measures of welfare”.
Done later.
Claim: There have been numerous attempts to build more holistic measures of welfare than GDP per capita.
re-write Claim: There have been >10 attempts to build “more holistic” measures of welfare than GDP per capita.
Note: I cant test “more holistic than GDP per capita” for example by checking if “life expectancy” is included in the parameter in addition to GDP per capita.
Note: Not sure of the value of reading papers to come to this conclusion. so skipping for now.
Claim: Jones’ consumption equivalent welfare measure allows comparisons across time for a given country.
re-write Claim: Jones’ consumption equivalent welfare measure can be computed for different times.
Note: Skipped as not interesting.
Claim: Jones’ consumption equivalent welfare measure allows comparisons across countries.
re-write Claim: Jones’ consumption equivalent welfare measure can be computed for different countries.
Note: Skipped as not interesting.
This measure of human welfare suggests that the true level of welfare of some countries differs markedly from the level that might be suggested by their GDP per capita. For example, France’s GDP per capita is around 60% of US GDP per capita.[7] However, France has lower inequality, lower mortality, and more leisure time than the US. Thus, on the Jones and Klenow measure of welfare, France’s welfare per person is 92% of US welfare per person.[8]
Claim: This measure of human welfare suggests that the true level of welfare of some countries differs markedly from the level that might be suggested by their GDP per capita.
re-write Claim: Jones’ measure of human welfare “differs significantly” 30% higher from the GDPPC level for some countries compared to that of it’s US counterpart.
Example-sub:
Jones’ measure of welfare per person for France compared to the US is 92% for 2005.
GDP per capita ratio of France compared to US in 2005 is 60%.
Definition: checks out that it is “significant” (more than 30% different).
Checklist: sub; Yes; pre; Yes; ecm; Yes;
Time: 10 mins
Although GDP per capita is distinct from this expanded welfare metric, the correlation between GDP per capita and this expanded welfare metric is very strong at 0.96, though there is substantial variation across countries, and welfare is more dispersed (standard deviation of 1.51 in logs) than is income (standard deviation of 1.27 in logs).[9]
Claim: GDP per capita is distinct from expanded welfare metric.
re-write Claim: GDPPC value for a country is different than Jones’ welfare metric.
Example-sub:
Jones’ measure of welfare per person for France compared to the US is 92% for 2005.
GDP per capita ratio of France compared to US in 2005 is 60%.
Definition: checks out.
Checklist: sub; Yes; pre; Yes; ecm; Yes;
Time: 2 mins.
Claim: GDP per capita and expanded welfare metric has a strong correlation.
re-write Claim: GDP per capita strongly correlates with Jones’ expanded welfare metric for different countries relative to the US for the year 2007.
Example-sub:
Figure 7 here shows 0.96 for the year 2007.
Definition: checks out.
Checklist: sub; Yes; pre; Yes; ecm; Yes;
Time: 10mins
Claim: Even though there is high correlation There is
substantial variation across countries.
Note: I don’t think the author of the blogpost is talking about the variation in GDP per capita across different countries. I think the is talking about the countries that are still far away from the correlation line and countries that are spot on, on the correlation line.
re-write Claim: Difference in Predicted welfare and plotted welfare (actual welfare metric of Jones’), across countries is “substantial” (atleast one order of magnitude larger).
Example-sub:
Based on graph figure 7. Values are in logs and with respect to US GDP and Welfare.
| Country | GDP per Cap | pred. welfare | Act. welfare | diff.% * | |———-|————-|—————|————–|———–| | Portugal | 1/2 | 1/2 | 1/2 | 0% | | Botswana | 1/4 | 1/4 | 1/32 | 700% | *diff is calculated as “Act. welfare - Pred. welfare” in terms of “Act. welfare”
Definition: In one case it is 0% difference and in the other case it is 700%. checks out as substantial.
Checklist: sub; Yes; pre; Yes; ecm; Yes;
Time: 60 mins (to understand what they were talking about as variation, and come up with example)
Claim: Welfare is more dispersed than income.
re-write Claim: Welfare has higher standard deviation than GDP per capita.
Example-sub: Welfare std. deviation is 1.51 is logs. Income std. deviation is 1.27 in logs. (as per the blog post.)
Definition: checks out.
Checklist: sub; Yes; pre; Yes; ecm; Yes;
Time: 15mins
Note: I don’t get why the std. deviation is 1.51 logs when the graph varies only from 0 to 1. I don’t think I understand the units in the plot. But I skip for now. and I don’t have the data to see what it means.
GDP per capita is also very strongly correlated with the Human Development Index, another expanded welfare metric.[10] If measures such as these are accurate, this shows that income per head explains most of the observed cross-national variation in welfare. It is a distinct question whether economic growth explains most of the observed variation across individuals in welfare. It is, however, clear that it explains a substantial fraction of the variation across individuals.
Claim: GDP per capita is also very strongly (>0.7) correlated with the Human Development Index.
Example-sub:
GDP per capita vs HDI is shown here.
For the year 2014 the correlation is 0.73.
Definition: checks out.
Checklist: sub; Yes; pre; Yes; ecm; Yes;
Time: 10mins
Claim: If measures such as these are accurate, this shows that income per head explains most of the observed cross-national variation in welfare.
Note: No idea what “if measure such as these are accurate” means. Does he mean that there was no data entry error? or if the data is “representative”? All of which I am not sure how to check.
Failed
re-write Claim: If measures such as these are accurate, GDP
per capita explains most of the observed cross-national variation in
welfare.
Note: For this I think I should look at R^2 value. As this attempts to explain the “amount of variation captured” in a variable. Correlation however appears to capture how close to the linear relationship the plot is.
re-write Claim: R2 value for GDP per capita vs Welfare is greater than 90%.
Example-sub: Correlation was found to be 0.96. This means R2 value
is 0.96^2=92%, for the year 2007.
Definition: Checks out.
Checklist: sub; Yes; pre; Yes; ecm; Yes;
Time: 40 mins. Took time to figure out this confusion in R2 and correlation and which to use.
Claim: It is a distinct question whether economic growth explains most of the observed variation across individuals in welfare.
Claim: It is, however, clear that it explains a substantial fraction of the variation across individuals.
Note: Am puzzled for at the outset these two claims appear to be exactly the same. With the difference being “most” and “substantial”. Is this “bad” writing according to an STM? (Highest karma points post ever in the forum vera). Maybe he was trying to differentiate between causation and correlation? Athukunu ipdiya?
Skipped.
This suggests that: taking this expansive account of human welfare, only so much can be achieved for a country holding its income per head at a low level. For instance, unless a country’s income per person is at least a quarter that of the US, then, empirically, its welfare per person can also not be more than a sixth that of the US.
Claim: taking this expansive account of human welfare, only so much can be achieved for a country holding its income per head at a low level.
re-write Claim: Using Jones welfare metric, only “so much can be achieved” for a country with “low GDP per capita”.
re-write Claim: Using Jones welfare metric, only “so much can be achieved” for a country with GDP <1/4th of US.
Note: I am getting mad at the fact that this sloppy writing (I cannot for the love of god understand what he is saying), is revered so highly (highest karma points post ever in forum) or is it just me?
re-write Claim: Unless a country’s income per person is at least a quarter that of the US, then, empirically, its welfare per person can also not be more than a sixth that of the US.
re-write Claim: Unless a country’s GDP per capita is >1/4 that of US, it’s welfare per person cannot be more than 1/6 that of US.
re-write Claim: If GDP per capita is >1/4 then Welfare per person >1/6
Example-sub: Malaysia Income >1/4 and <1/2. Malaysia welfare >~1/6
Definition: checks out.
Checklist: sub; Yes; pre; Yes; ecm; Yes;
Time: 40mins; very hard to understand this “unless” statement. Had to use an example. Really threw me off with the seeming double negative.
Crucially, on the Jones and Klenow welfare metric, most developing countries are substantially poorer than incomes suggest because of a combination of shorter lives and extreme inequality. Lower life expectancy reduces welfare by 15 to 50 percent in the developing countries Jones and Klenow examine, which implies that global welfare inequality is greater than global income inequality.[11] Therefore, ensuring evenly shared growth and improved health is also important for human welfare. We do not investigate the best way to do that here, though we think that these goals are best advanced outside of the constraints of directly funding RCT-backed interventions.
Claim: Most developing countries are substantially poorer than incomes suggest because of a combination of shorter lives and extreme inequality.
re-write Claim: Most developing countries are “substantially poorer” than incomes suggests.
re-write Claim: Many countries with GDP per capita <1/4th that of US, have their welfare to GDP per capita ratio <0.75.
Subject: Ratio of welfare to GDP per capita of countries with GDP per capita <1/4th that of US,
Predicate: <75%
Example-sub:
As per Figure 5 here. Values are as per 2007.
| Countries | GDP per capita | Ratio of welfare to GDP |
|---|---|---|
| India | 1/16 of US | 0.55 |
| Brazil | 1/6 of US | 0.65 |
| China | 1/10 of US | 0.65 |
Definition: <0.75… checks out.
Checklist: sub; Yes; pre; Yes; ecm; Yes;
Time: 15 mins
re-write Claim: “developing countries” life expectancy is “low” compared to “developed countries”.
re-write Claim: Life expectancy of countries with <1/4 US GDP, is lesser than countries with >1/4 GDP.
Example-sub:
| country | GDP per capita | Life expectancy |
|---|---|---|
| India | 1/16 of US | 64 |
| France | 1/2 of US | 81 |
Definition: checks out.
Checklist: sub; Yes; pre; Yes; ecm; Yes;
Time: 20mins
re-write Claim: “Developing countries” inequality is high.
re-write Claim: SD of log consumption of countries with <1/4 US GDP, is higher than countries with >1/4 GDP per capita.
Example-sub:
| country | GDP per capita | SD of log consumption |
|---|---|---|
| India | 1/16 of US | 0.45 |
| UK | >1/2 of US | 0.45 |
Source: Figure 1 here.
Definition: does not check out.
Checklist: sub; Yes; pre; Yes; ecm; Yes;
Time: 20mins
Claim: Lower life expectancy reduces welfare by 15 to 50 percent in the developing countries Jones and Klenow examine, which implies that global welfare inequality is greater than global income inequality.
re-write Claim: Lower life expectancy reduces welfare by 15 to 50 percent in developing countries.
Subject: The amount by which the welfare is reduced in developing countries, if they didn’t have “lower life expectancy”.
Predicate: 15 to 50 %
Note: The welfare metric is a formula which takes in life expectancy as an input.
Example-sub:
A life expectancy of only 67 years cuts Russia’s welfare by 50 log points, or around 40 percent—author of that same paper.
So, Welfare reduces by 40% at life expectancy of 67 years for Russia (compared to welfare at 77 years).
Definition: checks out.
Checklist: sub; Yes; pre; Yes; ecm; Yes;
Time: 30mins
re-write Claim: this implies, Welfare inequality appears to be
greater than income inequality.
Note: These guys from the blogpost left the “across countries” while copying sentences from said paper. I was puzzled as to what they were talking about. the following excerpt makes it clear they were not talking about the within country inequality.
“… across countries, welfare inequality appears even greater than income inequality.”—author of that same paper from which the blog post is “inspired”
re-write Claim: Across countries, welfare inequality appears even greater than income inequality.
Example-sub:
| Country | Welfare | GDP per person |
|---|---|---|
| France | 9/10 | 5/8 |
| India | 1/32 | 1/16 |
| Difference | 0.868 | 0.56 |
Definition: checks out that welfare inequality across countries much greater than income inequality.
Checklist: sub; Yes; pre; Yes; ecm; Yes;
Time: 60mins spent time on understanding how to extract log numbers and puzzling out what the author wanted to say.
Therefore, ensuring evenly shared growth and improved health is also important for human welfare. We do not investigate the best way to do that here, though we think that these goals are best advanced outside of the constraints of directly funding RCT-backed interventions.
Claim: Ensuring evenly shared growth and improved health is also important for human welfare.
re-write Claim: Reducing inequality and improving life expectancy increases human welfare.
re-write Claim: reducing standard deviation of log consumption for a country increases human welfare (Jones’ welfare metric).
re-write Claim: Standard deviation of log consumption for a country is lower implies higher human welfare.
Example-sub:
| Country | Standard deviation of log consumption | Welfare |
|---|---|---|
| France | 0.4 | 1 |
| India | 0.45 | 1/32 |
Definition: checks out.
Checklist: sub; Yes; pre; Yes; ecm; Yes;
Time: 10 mins
re-write Claim: Life expectancy increases, human welfare also increases.
Example-sub:
| Country | Life expectancy | Welfare (US=1) |
|---|---|---|
| France | 80 | 1 |
| India | 64 | 1/32 |
Definition: checks out.
Checklist: sub; Yes; pre; Yes; ecm; Yes;
Time: 10mins
We do not investigate the best way to do that here, though we think that these goals are best advanced outside of the constraints of directly funding RCT-backed interventions.
Claim: Improving health and evenly sharing growth are best advanced outside of the constraints of directly funding RCT-backed interventions.
re-write Claim 1: Increasing life expectancy of a country are
best advanced outside the constraints of directly funding
RCT-backed interventions.
re-write Claim: Life expectancy increase due to malaria aid in a country during 1950 to 2010 is better than life expectancy increase from 2000 to 2015.
Note: But this above rewritten claim is not representative of the initial claim. I am not looking at all “RCT-backed interventions”.
Failed
Example-sub:
-
Life expectancy increase due to malaria aid from 1950 to 2010 for African region: 1.2 years.
-
Life expectancy increase from 1950 to 2010 for African region: 9.6 years.
Definition: checks out.
Checklist: sub; Yes; pre; Yes; ecm; Yes;
Time: 7 mins.
re-write Claim 2: Reducing standard deviation of log consumption of a country is best advanced outside the constraints of directly funding RCT-backed interventions.
Failed
Life Expectancy
GDP per capita and life expectancy are correlated
Claim: GDP per capita and Life expectancy are correlated.
re-write Claim: GDP per capita and life expectancy have a correlation of >0.9.
re-write Claim: Log GDP per capita and life expectancy seem to have strong correlation (>0.7).
Example-sub:
This graph shows the life expectancy vs GDP per capita for 2015.
0.81 is the correlation–> 2015 data of Life expectancy vs Log GDP per capita for different countries.
Source: downloaded data in libre calc
Definition: checks out.
Checklist: sub; Yes; pre; Yes; ecm; Yes;
Time: 30mins, “correlated” and the “non-linearity” (log) were confusing initially.
As this chart shows, the life expectancy associated with a given level of real income is rising over time. If economic development were the only determinant of health, countries that get richer would just move along the same curve. Since this is not the case, we can conclude that economic development cannot be the sole determinant of health: highly efficient public health interventions also play a major role. 60 years of public health improvements since 1950 increase cross-national life expectancy on average by around 8 years.
Claim: Life expectancy associated with a given level of real income is rising over time.
re-write Claim: Life expectancy associated with given income is rising over time.
Example-sub:
This graph, shows the life expectancy vs. GDP per capita since 1800.
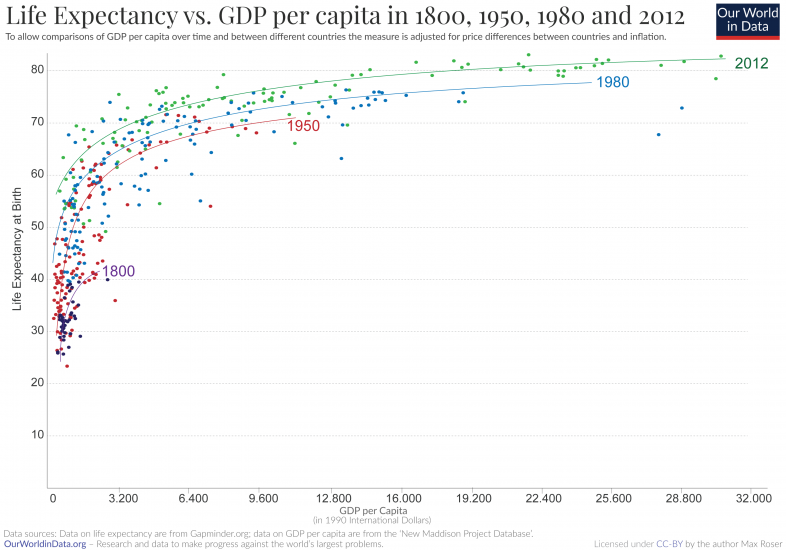
| GDP per capita | year | Life expectancy |
|---|---|---|
| 3200 USD | 1800 | 40 |
| 3200 USD | 1950 | 62 |
| 3200 USD | 1980 | 65 |
| 3200 USD | 2012 | 70 |
Definition: checks out.
Checklist: sub; Yes; pre; Yes; ecm; Yes;
Time: 10mins
Claim: If economic development were the only determinant of health, countries that get richer would just move along the same curve.
Claim: Economic development is the only determinant of life expectancy.
re-write Claim: Correlation of GDP per capita vs Life expectancy is 1.
Example-sub:
0.81 in 2015.
Source: downloaded data in libre calc
Definition: Doesn’t check out.
Checklist: sub; Yes; pre; Yes; ecm; Yes;
Time: 5 mins.
re-write Claim: “life expectancy vs GDP per capita” curves for different years are along the same curve.
Example-sub:
According to here, we see curve of 2012 different from curve of 1980 different from 1950 and 1800.
Definition: Does not check out.
Checklist: sub; Yes; pre; Yes; ecm; Yes;
Time: 10 mins.
re-write Claim: Life expectancy increases with GDP per capita and the year we live in.
Example-sub:
This graph, shows the life expectancy vs. GDP per capita since 1800.
Following shows, increase in Life expectancy with time for a given GDP per capita.
| GDP per capita | year | Life expectancy |
|---|---|---|
| 3200 USD | 1800 | 40 |
| 3200 USD | 1950 | 62 |
| 3200 USD | 1980 | 65 |
| 3200 USD | 2012 | 70 |
Following shows, increase in life expectancy with GDP per capita for a given time.
| GDP per capita | year | Life expectancy |
|---|---|---|
| 3200 | 2012 | 70 |
| 12800 | 2012 | 73 |
| 28000 | 2012 | 81 |
Definition: checks out that there atleast 2 variables that vary with Life expectancy.
Checklist: sub; Yes; pre; Yes; ecm; Yes;
Time: 15 mins
Claim: Highly efficient public interventions play a major role in life expectancy.
re-write Claim: Efficiency of public interventions and Life expectancy increased with time.
re-write Claim: Amount of money pumped into “malaria control
activities” and life expectancy increased over time.
Note: splitting it into two claims.
Example-sub:
| Year | Total Money pumped per year(pg8) |
|---|---|
| 2005 | around 1.2b USD |
| 2015 | around 3b USD |
Definition: checks out
Checklist: sub; Yes; pre; Yes; ecm; Yes;
Time: almost 60 mins then split to 2 claims.
re-write Claim: Life expectancy due to “malaria mortality reduction” increased over time.
Example-sub:
Life expectancy gain in African region (as per WHO) due to “malaria mortality reduction” is 1.4 years and 0.26 years across the entire world from 2000 to 2015.
Definition: checks out.
Checklist: sub; Yes; pre; Yes; ecm; Yes;
Time: almost 60 mins then split to 2 claims.
Note: It took a long time to come to any reasonable rewritten claim. I forgot to just translate causation claims to claims on trend. I completely skipped one of the variables and focused only the other.
Claim: 60 years of public health improvements since 1950 increase cross-national life expectancy on average by around 8 years.
re-write Claim: Cross-national life expectancy on average has increased by 8 years over 60 year time period since 1950.
Note: A bit time consuming to compute life expectancy on average in libre calc for 60 years so modified to check for a few examples.
re-write Claim: Life expectancy of many countries has increased by 8 years from 1955 to 2015.
Note: Whether it was due to public health improvements is skipped.
Example-sub:
| Country | 1955 Life expectancy | 2015 Life expectancy | Difference |
|---|---|---|---|
| UK | 70.1 | 81.1 | 11 |
| US | 69.3 | 78.9 | 9.6 |
| Jordan | 48.6 | 74.1 | >10 |
| Sudan | 45.9 | 68.6 | >10 |
| India | 38.4 | 64.4 | >10 |
| Niger | 34.6 | 60.6 | >10 |
Definition: Checks out.
Checklist: sub; Yes; pre; Yes; ecm; Yes;
Time: 10 mins
Nonetheless, the graph above shows that GDP per capita explains a significant fraction of the variation in life expectancy across countries. 60 years of sustained growth could shift a country from income per head of
$1,000 to$32,500.[12] Today, this would be correlated with, though would not necessarily wholly cause, an increase in life expectancy by more than 20 years, on average. Today, almost no countries with income per head above$10,000 have life expectancy below 70 years. Most countries with income below$5,000 per head have life expectancy below 70 years, and a significant fraction have life expectancy below 60.
Claim: GDP per capita explains a significant fraction of the variation in life expectancy across countries.
re-write Claim: R^2 value for Life expectancy vs log GDP per
capita for different countries is greater than 90% for a given year.
Example-sub: 66% R^2 value for the 2015 data of Life expectancy vs Log GDP per capita for different countries.
R2 informs the variation in Life expectancy captured by GDP per capita.
Source: downloaded data in libre calc
Definition: False. Doesn’t not check out.
Checklist: False; sub; Yes; pre; Yes; ecm; Yes;
Time: 60 mins (most of the time went in figuring out libre calc)
Claim: 60 years of sustained growth could shift a country from income per head of 1k USD to 32.5k USD.
re-write Claim: 60 years of “however you would measure sustained growth” could shift a country from income per head of 1k USD to 32.5k USD.
Failed: Unsure how to measure “sustained growth”.
re-write Claim: In 60 years it is possible to go from 1k USD GDP per capita to 32.5k USD GDP per capita.
Example-sub:
South Korea went from 1k USD to 32.5k USD, in the time period from 1960 to 2010.
Definition: checks out.
Checklist: sub; Yes; pre; Yes; ecm; Yes;
Time: 10 mins
Claim: Today, this would be correlated with, though would not necessarily wholly cause, an increase in life expectancy by more than 20 years, on average.
re-write Claim: An increase in 1k to 32.5k in GDP per capita in 2015, is correlated with an increase in life expectancy by more than 20 years.
re-write Claim: In 2015, a variation in GDP per capita from 1k to 32.5k USD between any two countries would imply that Life expectancy gap would be >20 years.
Example-sub:
| Country | GDP per capita 2015 (USD) | Life expectancy (years) |
|---|---|---|
| Sierre Leone | 1k | 54 |
| Czech Republic | 31k | 78 |
| Difference | 30k | 24 |
Definition: checks out.
Checklist: sub; Yes; pre; Yes; ecm; Yes;
Time: 20mins (“Correlated”, threw me off)
Claim: Today, almost no countries with income per head above
$10,000 have life expectancy below 70 years.
re-write Claim: Ratio of Number of countries with GDP per capita >10k USD but below life expectancy 70 years in 2016, to number of countries with GDP per capita >10k USD is < 10%.
Example-sub:
Number of countries with GDP per capita >10k & Life expectancy <70 years = 7.
Number of countries with GDP per capita >10k = 105.
Ratio is 6.6%.
Source: downloaded data in libre calc
Definition: checks out.
Checklist: sub; Yes; pre; Yes; ecm; Yes;
Time: 15mins
Claim: Most countries with income below $5,000 per head have life
expectancy below 70 years, and a significant fraction have life
expectancy below 60.
re-write Claim: 90% of the countries with GDP below 5000 USD per capita have life expectancy below 70 years for 2016.
Example-sub:
Number of countries with GDP below 5000 USD in 2016: 46.
Number of countries with GDP below 5000 USD in 2016 and Life expectancy <70 years: 41.
Source: downloaded data in libre calc
Definition: 41/46=~90%. Checks out.
Checklist: sub; Yes; pre; Yes; ecm; Yes;
Time: 6 mins.
re-write Claim: 75% of the countries with GDP below 5000 USD per capita have life expectancy below 60 years for 2016.
Example-sub:
Number of countries with GDP below 5000 USD in 2016: 46
Number of countries with GDP below 5000 USD in 2016 and Life expectancy <60 years: 10
Source: downloaded data in libre calc
Definition: 10/46=21.7% FALSE AF. Doesn’t check out. Really sloppy writing. There are only 12 countries below 60 years of life expectancy according to the chart even.
Checklist: sub; Yes; pre; Yes; ecm; Yes;
Time: 10 mins (to check if the conclusion was actually right)
Life satisfaction
GDP per capita is also correlated with self-reported life satisfaction:
Claim: GDP per capita is also correlated with self-reported life satisfaction:
re-write Claim: Log GDP per capita and self-reported life satisfaction country average for a given year have a correlation >0.9.
Example-sub:
Correlation of 0.72 is observed for the year 2017 between log GDP per capita and ‘self-reported life satisfaction country average’.
Definition: False.
Checklist: False; sub; Yes; pre; Yes; ecm; Yes;
Time: 15mins (downloading data types)
Once GDP per capita is above
$20,000, no countries have average life satisfaction scores below 5; once it is below$3,000, almost no countries have self-reported life satisfaction scores above 5.The chart below shows the strength of the relationship more clearly as it does not put income on a logarithmic scale:
Claim: Once GDP per capita is above $20,000, no countries have
average life satisfaction (ALS) scores below 5;
re-write Claim: If GDP per capita is above 20k USD, number of countries with ALS scores below 5 is 0 for a given year.
Example-sub:
We see that no countries exist where GDP per capita is above 20k USD & ALS scores are below 5.
Definition: Checks out.
Checklist: sub; Yes; pre; Yes; ecm; Yes;
Time: 10 mins (It is taking time to understand these “double if statements”, feel confused and puzzled)
Claim: Once it is below $3,000, almost no countries have
self-reported life satisfaction scores above 5.
re-write Claim: If GDP per capita is below 3k USD, then 0 countries have self-reported life satisfaction scores above 5.
Example-sub:
Tajikistan has a GDP per capita of 2897 USD and self-reported life satisfaction score of 5.83 for the year 2017.
Definition: False. Really sloppy writing.
Checklist: sub; Yes; pre; Yes; ecm; Yes;
Time: 5 mins.
Claim: The chart below shows the strength of the relationship more clearly as it does not put income on a logarithmic scale.
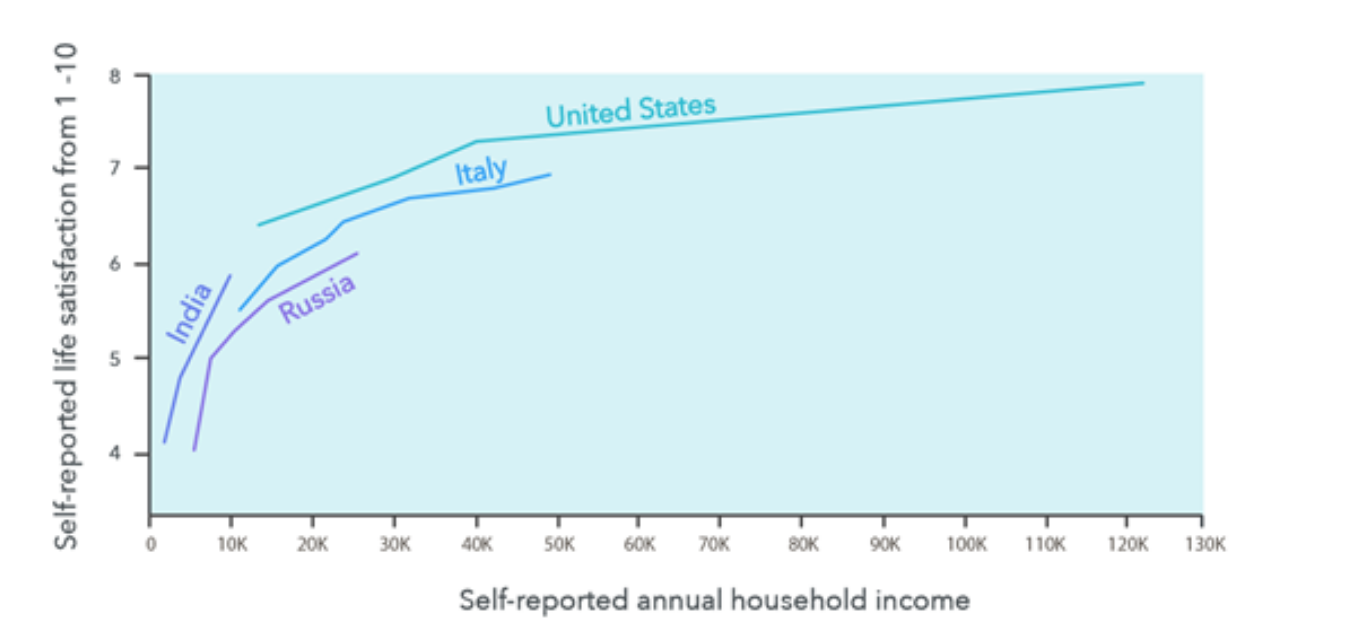
re-write Claim: The chart below shows “strength of the relationship” more clearly because it does not put income on a log scale.
re-write Claim: The chart below shows the correlation between self-reported household income vs self-reported life satisfaction average.
re-write Claim: The chart below shows the scatter plot and the trend/correlation line/curve for self-reported household income vs self-reported life satisfaction average.
Example-sub:
It shows lines/curves for US, India, Italy and Russia but there are no scatter plots over which the trend was obtained.
Definition: False.
Checklist: False; sub; Yes; pre; Yes; ecm; Yes;
Time: 20 mins
re-write Claim: The chart below shows the trend line “more clearly” than the charts with Log income per capita.
Note: I give up. God bless this writer. I don’t know how or across what dimension to measure “more clearly”.
Time: 20 mins
Failed
This shows the value of economic development for life satisfaction in low-income countries (as well as the limited benefits for rich countries).
Claim: This (graph) shows the value of economic development for life satisfaction in low-income countries (as well as the limited benefits for rich countries).
re-write Claim: Self-reported life satisfaction in low-income countries (sub 10k USD GDP per capita) increases with increase in income in that same country.
Example-sub:
| Country | self-reported life satisfaction | Income (USD) |
|---|---|---|
| India | 4 | 1k |
| India | 6 | 10k |
Definition: checks out.
Checklist: sub; Yes; pre; Yes; ecm; Yes;
Time: 15 mins (spend time on trying to figure out “shows value”)
Claim: There are limited benefits for rich countries.
re-write Claim: For a 10k USD increase in Income, rich countries (>30k GDP per capita) have lesser self-reported life satisfaction than poorer ones (1<10k GDP per capita).
Example-sub:
Low-Income Country–>
| Country | self-reported life satisfaction | Income (USD) |
|---|---|---|
| India | 4 | 1k |
| India | 6 | 10k |
| Difference | 2 | 10k |
High-Income Country–>
| Country | self-reported life satisfaction | Income (USD) |
|---|---|---|
| US | 7 | 30k |
| US | 7.3 | 40k |
| Difference | 0.3 | 10k |
Low-income countries have their satisfaction improve by 10k by 2 points while high-income countries go up by roughly 0.3 points.
Definition: checks out.
Checklist: sub; Yes; pre; Yes; ecm; Yes;
Time: 10 mins.
Poverty
GDP per capita is very strongly associated with poverty reduction, on standard low-bar poverty thresholds. Increasing median income above a certain level is empirically sufficient to eliminate
$1.90 a day poverty. Above a median income of$5,000, no country has low-bar poverty above 2.5%
Claim: GDP per capita is very strongly associated with poverty reduction, on “standard low-bar poverty thresholds”.
Note: Tried getting the data from as pointed by the author but it was taking too much time, hence I don’t show correlation.
re-write Claim: Headcount poverty rate (as a % of total pop) decreases with increase in “Median PPP annual income/consumption”, when below poverty is defined by 1.9 USD per day.
Example-sub:
Based on the following graph (pg 7) for year XXXX (for some reason getting year info is not straightforward), we see that,
| Headcount poverty rate @ USD 1.9/day | Median PPP annual income/consumption (USD) |
|---|---|
| 0.9 | <0.5k |
| 0.3 | 1k |
| 0.01 | 8k |
Definition: Checks out.
Checklist: sub; Yes; pre; Yes; ecm; Yes;
Time: 25 mins (“low bar”, trying to get the data, understanding what the data means)
Claim: Increasing median income above a certain level is
empirically sufficient to eliminate $1.90 a day poverty.
re-write Claim: Countries with median income >7500 USD have very low headcount poverty rate (poverty measured as <1.9 USD/day).
Example-sub:
<1% is the headcount poverty rate (<1.9 USD/day) for countries with median income >7500 USD.
Definition: checks out.
Checklist: sub; Yes; pre; Yes; ecm; Yes;
Time: 10mins
Claim: Above a median income of 5,000 USD, no country has low-bar poverty above 2.5%.
re-write Claim: Above a median income of 5k USD, no country has head count poverty rate >2.5% (poverty measured as <1.9 USD/day).
Example-sub:
Definition: checks out.
Checklist: sub; Yes; pre; Yes; ecm; Yes;
Time: 1 mins
Increasing median per capita income above a certain level is also empirically necessary to eliminate poverty. No country (but one) has pushed
$5.50/day poverty below 10 percent without increasing median income above 3,535$.[13]
Claim: Increasing median per capita income above a certain level is also “empirically necessary” to eliminate poverty.
re-write Claim: Above a median income of 5,000 USD, headcount poverty rate @1.9 USD/day is close to 1%.
Example-sub:
Definition: checks out.
Checklist: sub; Yes; pre; Yes; ecm; Yes;
Time: 5 mins
Claim: No country (but one) has pushed 5.50$/day poverty below 10
percent without increasing median income above $3,535.[13]
re-write Claim: Only one country has 10% headcount poverty rate
for poverty line of 5.50$/day with median income <3535 USD.
Example-sub:
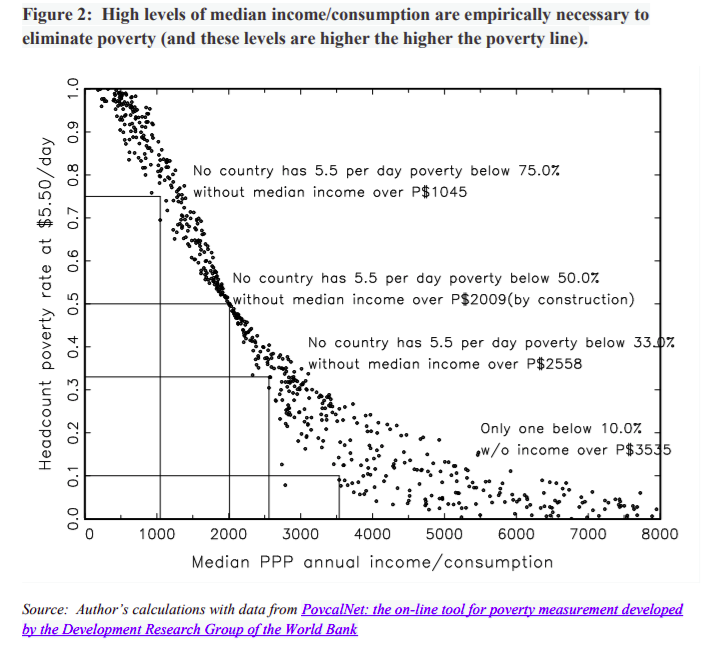
Definition: checks out.
Checklist: sub; Yes; pre; Yes; ecm; Yes;
Time: 10mins
GDP and other metrics
There is also a strong correlation between GDP per capita and other indicators of welfare such as: Reduced undernourishment, Literacy, Reduced child mortality, Sanitation
Claim: There is also a strong correlation between GDP per capita and Reduced undernourishment.
re-write Claim: There is also a correlation >0.7 between log GDP per capita and Share of population who are undernourished.
Example-sub:
Negative correlation of 0.62; 2016
Definition: Does not check out.
Checklist: False; sub; Yes; pre; Yes; ecm; Yes;
Time: 10mins
Claim: There is also a strong correlation between GDP per capita and Literacy.
re-write Claim: There is also a correlation >0.7 between log GDP per capita and Literacy rate of population older than 14 years.
Example-sub:
+ve correlation of 0.74; 2016
Definition: Checks out.
Checklist: sub; Yes; pre; Yes; ecm; Yes;
Time: 10mins
Claim: There is also a strong correlation between GDP per capita and Reduced child mortality.
re-write Claim: There is also a correlation >0.7 between log GDP per capita and child mortality rate (based on death before 5 years).
Example-sub:
-ve correlation of 0.79; 2016
Definition: checks out.
Checklist: sub; Yes; pre; Yes; ecm; Yes;
Time: 10mins
Claim: There is also a strong correlation between GDP per capita and sanitation.
re-write Claim: There is also a correlation of >0.7 between log GDP per capita and share of population with improved sanitation.
Example-sub:
0.83 +ve correlation; 2015
Definition: checks out.
Checklist: sub; Yes; pre; Yes; ecm; Yes;
Time: 5 mins
Economic growth as a driver of progress and the limitations of RD. The foregoing arguments show that GDP per capita is strongly correlated with many objective and subjective measures of welfare. Thus, empirical evidence shows that only so much can be achieved for a country at a low level of income per head. If a country has an income per head below
$5,000, it is very likely to do poorly on most objective and subjective measures of welfare. If a country’s income per head is above$20,000, it is very likely to do well on most objective and subjective measures of welfare.
Claim: The foregoing arguments show that GDP per capita is strongly correlated with many objective and subjective measures of welfare.
re-write Claim:
Log GDP per capita is strongly correlated (>0.7) with many (5/6) objective and subjective measures of welfare.
Example-sub:
| Variable (Objective or subjective)(o/s) | Correlation |
|---|---|
| Share of population with improved sanitation (o) | 0.83 |
| Child Mortality rate (o) | 0.79 |
| Literacy rate (o) | 0.74 |
| share of undernourished population(o) | 0.62 |
| self-reported life satisfaction (s) | 0.72 |
| Life expectancy (o) | 0.81 |
| Headcount poverty @1.96 dollar | - |
Definition: Checks out.
Checklist: sub; Yes; pre; Yes; ecm; Yes;
Time: 15mins
Claim: Thus, empirical evidence shows that only so much can be achieved for a country at a low level of income per head.
re-write Claim: Average life expectancy for countries with GDP per capita <5k is lower than Average life expectancy for countries with GDP per capita >20k.
Example-sub:
| GDP per capita (USD) | Avg. Life expectancy |
|---|---|
| >20k | 79 |
| <5k | 62 |
Based on Life expectancy vs. GDP per capita, 2015.
Definition: checks out.
Checklist: sub; Yes; pre; Yes; ecm; Yes;
Time: 15mins
Claim: If a country has an income per head below $5,000, it is
very likely to do poorly on most objective and subjective measures of
welfare.
Note: Not doing “most” as it is too much work. Just taking one example.
re-write Claim: Countries with income per head <5k USD, on average have <65years life expectancy.
Example-sub:
| GDP per capita (USD) | Avg. Life expectancy |
|---|---|
| <5k | 62 |
Based on Life expectancy vs. GDP per capita, 2015
Definition: checks out.
Checklist: sub; Yes; pre; Yes; ecm; Yes;
Time: 5 mins
Claim: If a country’s income per head is above $20,000, it is very
likely to do well on most objective and subjective measures of
welfare.
re-write Claim: Countries with income per head >20k USD, on average have >75years life expectancy.
Example-sub:
| GDP per capita (USD) | Avg. Life expectancy |
|---|---|
| >20k | 79 |
Based on Life expectancy vs. GDP per capita, 2015
Definition: checks out.
Checklist: sub; Yes; pre; Yes; ecm; Yes;
Time: 5 mins
As discussed above, there are also good reasons to believe that increased GDP per capita causes many of these increases in welfare. This suggests that when we are working out how to increase human welfare to the greatest extent possible, then we should start by figuring out how best to increase GDP per capita. However, to our knowledge, EAs have not publicly published any investigations of this question.
Claim: There are good reasons to believe that increased GDP per capita causes many of these increases in welfare.
Note: Only correlation was discussed above. What are those “reasons to believe” are not discussed.
re-write Claim: If there is a high GDP per capita across countries then there is high life expectancy, on average across countries.
Example-sub:
| GDP per capita (USD) | Avg. Life expectancy |
|---|---|
| >20k | 79 |
| <5k | 62 |
Based on Life expectancy vs. GDP per capita, 2015.
Definition: Checks out.
Checklist: sub; Yes; pre; Yes; ecm; Yes;
Time: 15 mins
Claim: When we are working out how to increase human welfare to the greatest extent possible, then we should start by figuring out how best to increase GDP per capita.
re-write Claim: If there is increase in GDP per capita then there is increase in human welfare.
Note: Answered several times in the past.
re-write Claim: To get the biggest increase in human welfare, we should find out best ways to increase GDP per capita.
Failed
Claim: EAs have not publicly published any investigations of this question.
re-write Claim: EAs have not published the “Best ways to increase GDP per capita”.
re-write Claim: EA orgs have not published blog posts or questions, attempting to answer the “Best ways to increase GDP per capita”.
re-write Claim: EA orgs have not published blog posts containing the words “GDP per capita”.
Example-sub:
Searched for “GDP per capita” in Open philanthropies website. The first hit did not even have “GDP” or “GDP per capita” in it.
However for GiveWell it does produce actual hits with “GDP per capita”.
Definition: Doesn’t check out.
Checklist: sub; Yes; pre; Yes; ecm; Yes;
Time: 15 mins
Moreover, the vast majority of proponents of RD do not tackle the question of whether the interventions they assess increase economic growth. Instead, RD is overwhelmingly focused on evaluating the success of programmatic attempts to solve a problem in a specific target population, such as depression, educational attainment, intestinal worms or malaria. This does not mean that the things assessed by RD do not increase economic growth at all: indeed some RD health interventions increase earnings and consumption later in life, and thus do increase growth to an extent. However, evaluating whether the effect size is trivial or not should be a top priority for proponents of RD. (Hauke discusses the relationship between health and growth in Appendix 3.4)
Claim: The vast majority of proponents of RD do not tackle the question of whether the interventions they assess increase economic growth.
re-write Claim: It is not possible to find words such as “economy” or “economic” or “GDP” or “GDP per capita” in many documents of GiveWell.
Example-sub:
In cost-effectiveness table or the posts on their top charities, we don’t find any of these words used.
Definition: checks out.
Checklist: sub; Yes; pre; Yes; ecm; Yes;
Time: 10 mins
re-write Claim: Output dimensions to assess interventions do not include economic growth or GDP per capita.
Example-sub:
In the post used to express “why Malaria Consortium is a top charity according to GiveWell”, the output dimensions used to asses interventions are –> cost-effectiveness, Cost per SMC treatment, expected expenses etc… Not economic growth or GDP per capita.
Definition: checks out.
Checklist: sub; Yes; pre; Yes; ecm; Yes;
Time: 5 mins
Claim: RD is overwhelmingly focused on evaluating the success of programmatic attempts to solve a problem in a specific target population, such as depression, educational attainment, intestinal worms or malaria.
re-write Claim: (RD)[1] works overwhelmingly focused on
(evaluating the success of programmatic attempts to solve a
problem)[2] in a (specific target population)[3], such as depression,
educational attainment, intestinal worms or malaria.
Time: 40 mins or more. (identifying how to answer it and researching the paper and finding useful info takes time)
Note: decided to split the claim. Above is too confusing.
re-write Claim: RD works on evaluating the success of programmatic attempts to solve a problem.
re-write Claim: GiveWell makes cost-effectiveness estimates of different interventions.
Example-sub:
Definition: checks out.
Checklist: sub; Yes; pre; Yes; ecm; Yes;
Time: 5mins
re-write Claim: RD works on specific target population.
Example-sub:
SMC is done in Nigeria, Sahel region in Africa. Not in the US.
Definition: checks out.
Checklist: sub; Yes; pre; Yes; ecm; Yes;
Time: 5 mins
Claim: This does not mean that the things assessed by RD do not increase economic growth at all.
re-write Claim: RD increases economic growth.
re-write Claim: Recipients of cash transfers have significantly
higher total expenditure.
Example-sub: 1000 USD was delivered to 10,500 households across 328 villages in Siaya, Kenya.
Expenditure has increased by USD PPP 293 (11.5% increase) 18 months after the start of transfers.
Definition: checks out.
Checklist: sub; Yes; pre; Yes; ecm; Yes;
Time: 30 mins
re-write Claim: Enterprise revenues per household is higher than in control villages.
Example-sub: USD PPP 343 per household for Treatment groups vs USD PPP 222.
Definition: checks out.
Checklist: sub; Yes; pre; Yes; ecm; Yes;
Time: 10 mins
Note: Unable to comment on the spillover effects as I am unable to “understand” what is said in the paper with my skimming.
Time: 30 mins.
Claim: Some RD health interventions increase earnings and consumption later in life, and thus do increase growth to an extent.
re-write Claim: Some RD health interventions “seem to” increase earnings “later in life”.
re-write Claim: Some health interventions increase after 4 years of start of intervention.
Example-sub:
“Another found that four years after youths received one-time grants, they earned 41% more on average than those who had not received grants.”
An increase of 41% compared to those who did not receive the grants, after 4 years of receiving one-time grants.
Definition: checks out.
Checklist: sub; Yes; pre; Yes; ecm; Yes;
Time: 20 mins
Claim: evaluating whether the effect size is trivial or not should be a top priority for proponents of RD.
re-write Claim: evaluating effect size of the increase in earnings due to RD interventions is “trivial”.
re-write Claim: evaluating effect size of the increase in earnings due to RD interventions is not “trivial”.
re-write Claim: evaluating effect size “triviality” should be top priority.
Failed
Claim: However, the evidence for health causing growth is weak and the effect is small.
Time: 1.5 hrs to read paper and see what in the hell this “weak evidence” could mean.
re-write Claim: There is weak correlation (<0.5) for life expectancy and GDP per capita across countries.
Example-sub:
Correlation of 0.81.
Source: downloaded data in libre calc
Definition: Does not check out.
Checklist: False; sub; Yes; pre; Yes; ecm; Yes;
Time: 5 mins
re-write Claim: Change in life expectancy vs change in GDP has weak correlation (<0.5).
Example-sub:
R^2 value is 0.5 => Correlation = 0.7
Definition: Does not check out.
Checklist: False; sub; Yes; pre; Yes; ecm; Yes;
time: 5 mins
Note: For the rest of it this “weak evidence” is not understood as the author uses some theoretical frame work to suggest there is “weak causal evidence” (not strong evidence of a weak effect) between health and GDP per capita. I skip that.
Independently of this, we do not believe that the vast majority of RD interventions are plausibly among the top 100 ways to increase growth. For example, it is implausible that direct funding of the following interventions is the best way to increase GDP per capita:[14]
Claim: The vast majority of RD interventions are plausibly not among the top 100 ways to increase growth.
Note: Don’t’ know where such a tier list exists.
Note: There is a way to compare RD intervention that has evidence of increasing income, and “growth accelerations” in GDP per capita. This is dealt with towards the far end of this excercise.
Claim: It is implausible that direct funding of the following interventions is the best way to increase GDP per capita such as malaria bednets, cash transfers etc…
re-write Claim: Best way to increase GDP per capita is not through malaria bednets or cash transfers.
Note: The author refers to another link for the above claim, where it suggests 4 tests to identify if X is an “important determinant” of economic growth. The following are the tests in “re-write Claim’s”.
re-write Claim: Developed countries have more cash transfers than less developed countries.
Example-sub:
More developed countries vs less developed countries:
| Country | GDP per capita | Population |
|---|---|---|
| Netherlands | 53k | 17m |
| Kenya | 1.7k | 51m |
Netherlands has unemployment benefits (a form of cash transfer by the
govt.) for the unemployed (for a certain period) where it pays 70% of
the salary (avg. salary=36.5k EUR). In 2018 there was an unemployment
rate of 3.5%. Assuming 1% of the unemployed got the benefits, this
amounts to 17mx3.5%x70%x36.5kEURx1%=200m USD.
Regarding Kenya, GiveDirectly managed to pump only 32m in cash transfers. This seems to be the only monetary aid they get. There seem to be no unemployment benefits (insurance) or other ways to get benefits in Kenya.
Definition: Checks out.
Checklist: sub; Yes; pre; Yes; ecm; Yes;
Time: 90mins (finding evidence that could be used was insanely hard)
re-write Claim: Developed countries have more cash transfers now
than they did in 1870 1900s.
Example-sub: Assuming population increase as a proxy for cash transfers increase.
For Netherlands, Population in 1900s was 5m. Today it is at 17m.
Definition: checks out.
Checklist: sub; Yes; pre; Yes; ecm; Yes;
Time: 45mins (finding the proxy and looking up info)
re-write Claim: Cash transfers were part of “developmental success” from the 1950s
Failed
re-write Claim: Cash transfers were part of “rapid development” of countries and no “slow development” of countries.
Failed
The reason these things (RD interventions) are unlikely to be the best way to increase growth is that they play no role in the causal story of the huge differences in GDP per capita across space and time.
Claim: unlikely to be the best way to increase growth.
Claim: they (RD interventions) play no role in the causal story of the huge differences in GDP per capita across space and time.
re-write Claim: Interventions backed by RCTs are not the reason why China rose to power.
re-write Claim: It is not possible for healthcare expenditure alone to create the massive rise in GDP since 1990s.
re-write Claim: Healthcare expenditure per capita as a percentage of GDP per capita decreases since 1990s.
Failed?
Example-sub:
2.5% in 1995
3.6% in 2000
4.1% in 2005
4.7% in 2010
5.7% in 2014
Definition: Does not check out.
Checklist: False; sub; Yes; pre; Yes; ecm; Yes;
re-write Claim: Healthcare expenditure per capita vs GDP per capita is poorly/negatively correlated for China.
Example-sub: 0.99 correlation
Definition: Does not check out.
Checklist: False; sub; Yes; pre; Yes; ecm; Yes;
Time:2 hrs (last 2)(unable to agree on how to reduce the claim to measurable ones)
Note: Don’t know how else to check if RD interventions were not the reason or not for GDP increase.
re-write Claim: Vaccinations poorly or negatively correlate with GDP per capita for China.
Example-sub: 0.77 correlation
Definition: False;
Checklist: False; sub; Yes; pre; Yes; ecm; Yes;
Time: 10mins
- It is not the case that Danish people are better off than Ugandans because they have implemented direct programmatic efforts of this kind to a greater extent.
- It is not the case that Danish people today are better off than Danish people 100 years ago because they implemented this type of intervention.
- When looking at the huge human welfare gains in China, Indonesia, Vietnam, Singapore, South Korea and Hong Kong in the second half of the 20th century, no-one argues that this was because they engaged in more interventions of this type.
Claim: It is not the case that Danish people are better off than Ugandans because they have implemented direct programmatic efforts of this kind to a greater extent.
re-write Claim: Danish people are better off than Ugandans.
re-write Claim: Danish people have a higher GDP per capita than Ugandans.
Example-sub:
Danish: 45k USD Ugandans: 1.9k USD
Definition: checks out.
Checklist: sub; Yes; pre; Yes; ecm; Yes;
Time: 5 mins
re-write Claim: Danish people have higher life expectancy than Ugandans.
Example-sub:
Danish: 80 years in 2015
Ugandans: 62 years in 2015
Definition: checks out.
Checklist: sub; Yes; pre; Yes; ecm; Yes;
Time: 5 mins
re-write Claim: Danish people investment in direct interventions is similar to Ugandan investments for a given population.
Unless and Until I have a way to measure “direct interventions”, I am not going to get anywhere. When I first read this… I sided with the author initially. But the baseline starting point is not the same for both the countries. I mean dev econ is insanely hard science. I try to measure “investment in direct interventions” with “healthcare expenditure”.
re-write Claim: Healthcare expenditure per capita for Danish people has been of similar order compared to Ugandans since 1950 atleast.
Example-sub:
| Country | Year | Healthcare per capita | GDP per capita |
|---|---|---|---|
| Denmark | 1995 | 1875 USD | 37k USD |
| Uganda | 1995 | 45 USD | 916 USD |
| Denmark | 2014 | 4.7k USD | 45k USD |
| Uganda | 2014 | 132 USD | 1.6k USD |
Definition: Not TRUE.
Checklist: sub; Yes; pre; Yes; ecm; Yes;
Time: 20 mins
Claim: It is not the case that Danish people today are better off than Danish people 100 years ago because they implemented this type of intervention.
re-write Claim: Danish people today have higher life expectancy and GDP per capita now than in 1950.
Example-sub:
Danish life expectancy 80 years in 2015 Danish GDP per capita: 45k USD in 2015
Danish life expectancy 70.4 years in 1950
Danish GDP per capita: 9.3k USD in 1950
Definition: checks out.
Checklist: sub; Yes; pre; Yes; ecm; Yes;
Time: 10 mins
re-write Claim: Healthcare expenditure per capita as a percentage of GDP per capita decreases or is constant.
Example-sub:
| Country | Year | Healthcare per capita | GDP per capita | ratio |
|---|---|---|---|---|
| Denmark | 1995 | 1875 USD | 37k USD | 5% |
| Denmark | 2014 | 4.7k USD | 45k USD | 10% |
Definition: Doesn’t check out.
Checklist: sub; Yes; pre; Yes; ecm; Yes;
Time: 15 mins
Claim: When looking at the huge human welfare gains in China, Indonesia, Vietnam, Singapore, South Korea and Hong Kong in the second half of the 20th century, no-one argues that this was because they engaged in more interventions of this type.
re-write Claim: There were huge Life expectancy increases in China, Indonesia, Vietnam, Singapore, South Korea and Hong Kong.
re-write Claim: Life expectancy gains are greater than 20 years from 1950 to now.
Example-sub:
| Country | Life Expectancy 1950 | Life Expectancy 2016 | Diff |
|---|---|---|---|
| China | 42 | 76 | 34 |
| Indonesia | 40 | 71 | 30 |
| Vietnam | 51 | 75 | 24 |
| Singapore | 58 | 83 | 25 |
| South Korea | 35 | 82 | 47 |
| Hong Kong | 62 | 84 | 22 |
Definition: Impressive. Checks out.
Checklist: sub; Yes; pre; Yes; ecm; Yes;
Time: 15 mins
re-write Claim: Healthcare expenditure per capita or public health expenditure per capita as a % of GDP per capita decreases or stays constant.
Example-sub:
| Country | year | Healthcare exp per cap (USD) | GDP/cap (USD) | Ratio(%) |
|---|---|---|---|---|
| China | 1995 | 64 | 2.5k | 2.5 |
| China | 2014 | 730 | 12.7k | 5.7 |
| Indonesia | 1995 | 85 | 6k | 1.4 |
| Indonesia | 2014 | 299 | 10k | 2.9 |
| Vietnam | 1995 | 73 | 1.9k | 3.8 |
| Vietnam | 2014 | 390 | 5.2k | 7.5 |
| Singapore | 1995 | 972 | 44k | 2.2 |
| Singapore | 2014 | 4k | 80k | 5 |
| South Korea | 1995 | 492 | 16k | 3 |
| South Korea | 2014 | 2.5k | 33k | 7.5 |
Definition: Does not check out.
Checklist: False; sub; Yes; pre; Yes; ecm; Yes;
Time: 30mins
The role of direct programmatic assistance in explaining the variance in economic outcomes is mirrored in surveys of people who have moved out of poverty. The role of direct NGO programmatic assistance is as small as we would expect, given the above. In a survey of 4,000 people across three states in India, 3 named “NGO assistance” (only slightly ahead of one person each naming “illegal activity” and “winning the lottery”).
Claim: The role of direct programmatic assistance in explaining the variance in economic outcomes is mirrored in surveys of people who have moved out of poverty.
re-write Claim: Role of interventions in improving incomes of people out of poverty (1.9 USD/day) is poor.
re-write Claim: Average income before intervention is <1.9 USD/day and after intervention is still less than <1.9 USD/day.
Example-sub:
For the Graduation Programme cited here to “bring people out of poverty” (Source: Table 1), in Pakistan people with salary of <1.74 USD/day were accepted.
Note: Assuming consumption if higher, then income is higher.
Non-durable annual consumption “as a result of the program per
household” = 451 USD PPP. Assuming 2 people even per household, this
becomes 451/365/2=0.61$ PPP per day.
Definition: We see that consumption does not increase to >1.94 USD/day. Checks out if consumption as proxy, is accepted.
Checklist: sub; Yes; pre; Yes; ecm; Yes;
Time: 15 mins.
re-write Claim: According to surveys of people “who moved out of poverty”, % change denoted to NGOs help in getting people “out of poverty” compared to the peoples’ own effort more than 1 order smaller.
Example-sub:
In a survey across 14 different countries and 3 states of India, people ranked level of living of households today and their level 10 years ago. This identified 4k households that “moved out of poverty” were asked what is the primary reason they got out of poverty.
60.1% was denoted as due to individual initiative. 0.3% was denoted as due to NGO assistance (3.4% was denoted as dues to functioning of government).
Definition: 2 orders smaller.
Checklist: sub; Yes; pre; Yes; ecm; Yes;
Time: 20 mins. (reading the paper to see if there is more info)
Note: The author already notes that this is subject to all sorts of subjectivity biases. Nevertheless presents it.
Claim: The role of direct NGO programmatic assistance is as small as we would expect, given the above.
same as above.
Claim: In a survey of 4,000 people across three states in India, 3 named “NGO assistance” (only slightly ahead of one person each naming “illegal activity” and “winning the lottery”).
Note: Above is not a claim.
It is true that there might be biases at play here that may cause under-reporting of NGO assistance as a cause of escape from poverty. Firstly, people may naturally want to attribute their success to their own hard work, even if NGOs did play a role. Secondly, the impact of some NGOs may be difficult to see, even for beneficiaries. For example, most people may not be able to notice the substantial effect of salt iodisation or the Green Revolution on their lives because such work is largely invisible to them. Nonetheless, this survey does suggest that direct funding of RCT-backed interventions have played a very small role in escape from poverty.
Claim: There might be biases at play here that may cause under-reporting of NGO assistance as a cause of escape from poverty.
re-write Claim: There are biases at play (that may cause under-reporting of NGO assistance).
Failed
Claim: People may naturally want to attribute their success to their own hard work, even if NGOs did play a role.
Failed
Claim: Impact of some NGOs may be difficult to see, even for beneficiaries.
re-write Claim: Impact of NGOs might be hard to see for beneficiary.
re-write Claim: Determining the impact of NGOs needs a lot of people to cooperate and time.
Example-sub:
Impact of NGOs: Increase in average “annual harvest value” increases by 76 USD for people provided with free ITNs (Insecticide Treated Nets).
People: In addition to the people performing and analyzing the survey, data from 516 farmers over 1 year was required to determine the impact.
Definition: Checks out.
Checklist: sub; Yes; pre; Yes; ecm; Yes;
Time: 25 mins.
re-write Claim: Determining the impact of NGOs has other issues as well.
Example-sub:
In the same study seen above, it turns out that there is a “baseline imbalance” between treatment and control groups, which GiveWell thus views as “weak”.
Definition: Checks out?
Note: I am almost positive STM is going to be unhappy with this one as I merely quoted someone saying something, like I did in the earlier practice sessions. But I want to rely on the shoulders of Giants otherwise it takes too much time. I could go into the paper and find out what exactly that meant and how much the “imbalance” was.
Checklist: sub; Yes; pre; Yes; ecm; Yes;
Time: 15 mins.
Claim: Most people may not be able to notice the substantial effect of salt iodization or the Green Revolution on their lives.
re-write Claim: Noticing the effect of salt iodization on ones life is hard.
re-write Claim: It is not possible to notice the effect of salt iodization or Green Revolution.
Example-sub:
Well. If you get Goiter you can know that your iodine intake is not correct. Similarly if your crop makes 10 times when using IR8 yields vs “traditional varieties”.
Definition: False.
Checklist: sub; Yes; pre; Yes; ecm; Yes;
Failed?
Claim: Nonetheless, this survey does suggest that direct funding of RCT-backed interventions have played a very small role in escape from poverty.
re-write Claim: Survey of 4000 households suggests that “NGO Assistance”, has played a very small role in escape from poverty.
Example-sub:
In a survey across 14 different countries and 3 states of India, people ranked level of living of households today and their level 10 years ago. This identified 4k households that “moved out of poverty” were asked what is the primary reason they got out of poverty.
60.1% was denoted as due to individual initiative. 0.3% was denoted as due to NGO assistance (3.4% was denoted as dues to functioning of government).
Definition: checks out.
Checklist: sub; Yes; pre; Yes; ecm; Yes;
Time: 2 mins.
Overall, it would be very surprising if directly funding RD interventions turned out to be the best way to increase growth (especially given that they were not recommended on that basis in the first place). Given the strength of the correlation between growth and welfare, this should lead us to question whether RD is the best way to increase welfare.
Claim: Overall, it would be very surprising if directly funding RD interventions turned out to be the best way to increase growth (especially given that they were not recommended on that basis in the first place).
Note: discussed before and Failed.
Claim: High correlation between growth and welfare metric.
Example-sub: 0.95 as per 2007 data.
Definition: checks out.
Checklist: sub; Yes; pre; Yes; ecm; Yes;
Time: 5 mins.
What does explain cross-national differences in GDP per capita?
Thus, many RCT-backed interventions do not seem to explain much of the cross-national variation in GDP per capita. What does? There are a range of factors including: Growth-friendly policies, Geography, Natural resources, Human Capital, Culture.
Claim: RCT-backed interventions do not seem to explain much of the cross-national variation in GDP per capita.
so far “RCT-backed interventions” was being measured with estimates on “health expenditure”. They do have a strong (>0.7) correlation. So I don’t know what the author was talking about.
Failed
Claim: Factors that explain the cross-national variation in GDP per capita are: Growth-friendly policies, Geography, Natural resources, Human Capital, Culture.
re-write Claim: “Growth-friendly policies” explain the cross-national variation in GDP per capita.
re-write Claim: “Trade liberalization” explains the cross-national variation in GDP per capita.
Assuming Trade Liberalization can be measured by “trade openness”, we can look at trade openness index and GDP per capita within EU.
re-write Claim: EU countries Trade Openness Index is strongly correlated with GDP per capita.
Example-sub:
| Country | TDI (2017) | GDP per capita (k USD) (2016) |
|---|---|---|
| Netherlands | 160.00% | 49.2 |
| Germany | 90.00% | 46.8 |
| Sweden | 86.00% | 44.3 |
| Spain | 65.00% | 31.5 |
| France | 62.80% | 38.7 |
| United Kingdom | 62.40% | 39.1 |
| Italy | 59.50% | 34.9 |
| Belgium | 169.40% | 39.7 |
| Poland | 102.70% | 26.0 |
| Portugal | 85.20% | 27.7 |
Out of countries in EU, correlation: 0.3.
Source: GDP per capita, Trade Openness Index
Definition: Extremely weak correlation. Doesn’t check out.
Checklist: False; sub; Yes; pre; Yes; ecm; Yes;
Time: 2hrs (very hard to focus. I had no belief that I was going to even come to an example with this claim. Struggled like hell to go from “Growth-friendly policies” to something measurable. I guess I was looking for things like certain trade policies that led to X amount of GDP before and after. In the end ended up with TDI.)
re-write Claim: Geography explains cross-national variation in GDP per capita.
Example-sub:
| Country | Market potential | GDP per capita (2016) |
|---|---|---|
| Netherlands | 183 | 49.2 |
| Germany | 152 | 46.8 |
| Sweden | 91 | 44.3 |
| Spain | 89 | 31.5 |
| France | 153 | 38.7 |
| United Kingdom | 169 | 39.1 |
| Italy | 116 | 34.9 |
| Belgium | 194 | 39.7 |
| Portugal | 76 | 27.7 |
| US | 82 | 53 |
| Australia | 21 | 44.7 |
| Denmark | 136 | 45.1 |
| Greece | 70 | 24.6 |
Has a correlation of 0.24 out of the selected countries.
-
Market potential is a measure of proximity of one country to another.
Definition: Does not check out.
Checklist: sub; Yes; pre; Yes; ecm; Yes;
Time: 20mins (much better than yesterday. Fuck I died yesterday.)
re-write Claim: Natural Resources explains the cross-national variation in GDP per capita.
re-write Claim: Oil production (measured in terawatt-hour (TWh) equivalents per year) is strongly correlated with GDP per capita.
Note: Do not have single charts “Our World In Data” so just going to look at some countries.
re-write Claim: Countries with higher oil production, have higher GDP per capita.
Example-sub:
| Country | Oil Production (TWh) | GDP per Capita (USD) |
|---|---|---|
| US | 8237 | 52.5k |
| Saudi Arabia | 6853 | 47.5k |
| Russia | 6398 | 23.1k |
| China | 2695 | 12k |
| Qatar | 1211 | 139k |
| India | 576 | 5.6k |
Definition: checks out as most of them except Qatar.
Checklist: sub; Yes; pre; Yes; ecm; Yes;
Time: 25mins (Looking at data and copying values)
re-write Claim: Human capital explains the cross-national variation in GDP per capita.
re-write Claim: Human Capital Index is strongly correlated with GDP per capita.
Example-sub:
0.71 for the year 2016.
Definition: Checks out.
Checklist: sub; Yes; pre; Yes; ecm; Yes;
Time: 10mins
re-write Claim: Culture explains the cross-national variation in GDP per capita.
Note: Like how do you measure “culture”. am not sure. I can literally interpret it as anything. Woman’s rights? Transport accidents? Waste? Vaccination? working hours? etc…
re-write Claim: Number of working hours correlates with GDP per capita.
Example-sub:
0.33 for the year 2000 based on Our World In Data.
Definition: doesn’t check out.
Checklist: sub; Yes; pre; Yes; ecm; Yes;
Time: 20mins (identifying something related to measuring culture)
Within growth-friendly policies generally, some hits-based forms of RD may be promising. For example, the Green Revolution was a form of randomista development, and scale-up of that agricultural technology has saved the lives of hundreds of millions of people. There is also a correlation between educational performance and GDP per capita.16 Thus, it is possible that scaling up RCT-backed educational interventions would increase GDP per capita. Assessing whether this and other RD interventions would be the most cost-effective way to increase GDP per capita should be a top priority for effective altruists.
Claim: Within growth-friendly policies generally, some hits-based forms of RD may be promising.
re-write Claim: Within policies that seem to increase GDP per capita, there exists some “hits-based” interventions that could save millions of lives.
re-write Claim: Green revolution producing large amounts of food and the steep increase in GDP per capita, happen within 5years of each other.
re-write Claim 1: Time of producing enough food for the country and never before seen slopes in GDP per capita increase, happen within 10 years of each other.
Example-sub: The “seeds” for increasing the yield in Mexico started in 1941 by investment in researching and spreading techniques to improve yield which seems to have led to them in 1956 producing enough food to feed the country.
At 1962 point we observe the GDP per capita starting to soar to never before seen slopes from as shown here (in roughly 70 years).
Note: I am aware the “slope part” is not well defined.
Definition: checks out.
Checklist: sub; Yes; pre; Yes; ecm; Yes;
Failed “never before seen slopes”
Time: 67mins+30 mins (coming to this claim and reading about the Green revolution was taking time)
re-write Claim 2: Green Revolution is a high-risk-high-reward intervention.
Example-sub: At the time in 1950, people didn’t seem to know about the effects this would have on inequal growth in the country (rich get richer poor get poorer).
“Development practitioners now (after decades from 1956) have a better understanding of the conditions under which the Green Revolution and similar yield-enhancing technologies are likely to have equitable benefits among farmers”.
Definition: checks out?
Failed
Checklist: sub; Yes; pre; Yes; ecm; Yes;
Time: 15 mins.
re-write Claim 3: There exist interventions that saved millions of lives (proxy for “high-reward”).
re-write Claim: 2 decades after Mexico was able to satisfy their own needs for food, the global poverty dropped despite an increase in population.
Example-sub:
Year in which Mexico was able to manage its own needs for food: 1962
“The absolute number of poor people fell from 1.15 billion in 1975 to 825 million in 1995 despite a 60 percent increase in population. In India, the percentage of the rural population living below the poverty line fluctuated between 50 and 65 percent before the mid-1960s but then declined steadily to about one-third of the rural population by 1993.”— Source
Definition: checks out.
Note: Could be done better, but not sure how atm.
Checklist: sub; Yes; pre; Yes; ecm; Yes;
Time: 30 mins (finding evidence)
Claim: The Green Revolution was a form of randomista development.
re-write Claim: Improving yield of crops involved experiments with Rice hybrids.
Example-sub:
In order to go from 2 tonnes per hectare to 7 tonnes per hectare of yield, scientists experimented with 38 crosses involving rice varieties from China, Taiwan and Indonesia.
“the IR8 rice produced around 5 tons per hectare with no fertilizer and rose to almost 10 tons with 120 kg of nitrogen per hectare. That was 10 times the traditional rice yield.”
Definition: checks out.
Checklist: sub; Yes; pre; Yes; ecm; Yes;
Time: 30 mins (checking for RCTs and trying to come to a claim that can be tested)
Claim: Correlation between educational performance and GDP per capita.
re-write Claim: Small percent of people having a score above 400, is observed in developing regions compared to developed countries (GDPPC >40k USD).
Example-sub:
| Country | % above score 400 | GDP per capita >40k or NOT |
|---|---|---|
| Netherlands | 95% | Yes |
| Ghana | 40% | No |
Definition: checks out.
Checklist: sub; Yes; pre; Yes; ecm; Yes;
Time: 45 mins (finding something that can translate to educational performance and reading the)
Claim: Scaling up RCT-backed educational interventions would increase GDP per capita.
“would” “Future” skip. Failed
Claim: Assessing whether this and other RD interventions would be the most cost-effective way to increase GDP per capita should be a top priority for effective altruists
“should” “opinion poll types?” Failed
However, many of the most promising growth-friendly policies are economic policies that cannot be tested by RCTs (though their impact is not outside the realm of empirical investigation, see Appendix 2.2). These would include things like:
- Infrastructure spending
- Economic liberalization (Hong Kong, China)
- Trade liberalization (India)
- Export-led development and state
- protection of industry (South Korea, China)
Claim: Many of the most promising growth-friendly policies cannot be tested by RCTs.
re-write Claim: most Trade Liberalization policy change in
India cannot be tested by RCTs.
Note: For RCTs, Ideally you need a control group almost exactly as same as India. Let’s call it India*. Then you want administer the policy intervention to India and keeping the rest same for India* and compare the differences. But where are we going to get India*?
re-write Claim: (checking for similar baselines), No country is similar to India atleast in terms of population and GDP per capita (together).
Example-sub:
The closest to India’s population is from China, but it’s GDP per Capita is 5 times larger than that of India.
Definition: checks out.
Checklist: sub; Yes; pre; Yes; ecm; Yes;
Time: 30 mins (spent time on coming up with what to test)
re-write Claim: Interventions can be “RCT tested” within a country by comparing “similar” groups of villages and administering interventions to one of them.
Note: I would like to test then, one part of “RCT tested”: Ability to randomly select the treatment and control villages.
re-write Claim: Randomization (random allocation of treatment and control groups) is achievable while testing effects of interventions on the income of people in villages.
Example-sub:
In section 1.3 of this paper, which informs the measures of income growth of households upon cash transfer intervention, we see that they randomized the allocation of treatment, control, “high saturation” and “low saturation” with 653 villages.
Definition: checks out.
Checklist: sub; Yes; pre; Yes; ecm; Yes;
Time: 30 mins atleast (very hard identifying “RCT-tested”)
Claim: Impact of growth-friendly policies is not outside the realm of empirical investigation.
re-write Claim: GDP per capita increase compared to TDI is not outside the realm of empirical investigation.
re-write Claim: TDI correlates with GDP per capita weakly (>0.2).
Example-sub:
| Country | TDI (2017) | GDP per capita (k USD) (2016) |
|---|---|---|
| Netherlands | 160.00% | 49.2 |
| Germany | 90.00% | 46.8 |
| Sweden | 86.00% | 44.3 |
| Spain | 65.00% | 31.5 |
| France | 62.80% | 38.7 |
| United Kingdom | 62.40% | 39.1 |
| Italy | 59.50% | 34.9 |
| Belgium | 169.40% | 39.7 |
| Poland | 102.70% | 26.0 |
| Portugal | 85.20% | 27.7 |
Correlation: 0.3.
Source: GDP per capita, Trade Openness Index
Definition: checks out with a 0.3 (weak correlation)
Checklist: sub; Yes; pre; Yes; ecm; Yes;
Time: 10 mins
re-write Claim: There are papers that write about the causation of GDP per capita due to increase in Trade, based on existing data and “modeling”.
Example-sub:
This paper: “Does Trade Cause Growth?”
Definition: checks out.
Failed?
Checklist: sub; Yes; pre; Yes; ecm; Yes;
Time: 10mins
“… [Development] is fundamentally a process of social transformation—markets (and their supporting institutions and organizations (e.g. firms)) are social mechanisms that structure how people cooperate, governments (and their supporting institutions (e.g. agencies)) are social mechanisms. This social process of national development reliably produces higher human well-being in every dimension. However, no one can reliably and rigorously demonstrate exactly which actions best promote development (as, almost certainly they are contextual and complex) and certainly no one can reliably attribute development to specific organizations (and doing so may, in and of itself, cause less effectiveness).”[17]
Claim: Development is a process of social transformation.
Claim: Markets are social mechanisms.
Claim: Governments are social mechanisms.
Claim: This social process of national development reliably produces higher human well-being in every dimension.
Note: Not checking every dimension but just one.
re-write Claim: All the shit that has happened so far, has increased the life expectancy over the last 50 years for the entire world.
Example-sub:
Life Expectancy has increased from 1966 until 2015, going up all the time.
Definition: checks out.
Checklist: sub; Yes; pre; Yes; ecm; Yes;
Time: 30mins (got in wrong in the beginning and then changed it. translation to Re-Write Claim: was hard)
Claim: No one can reliably and rigorously demonstrate exactly which actions best promote development.
Failed
Claim: No one can reliably attribute development to specific organizations.
Failed
This should lead us to be skeptical about RD. Growth is arguably the major driver of human progress, but proponents of RD rarely argue that the interventions that they recommend do increase growth.
Claim: We have to be skeptical about RD causing increase in GDP per capita.
Failed “advice?” “have to” “should”
re-write Claim: Cash Transfers increase GDP per capita.
re-write Claim: Recipients of cash transfers have significantly
higher total expenditure.
Example-sub: 1000 USD was delivered to 10,500 households across 328 villages in Siaya, Kenya.
Expenditure has increased by USD PPP 293 per year (11.5% increase) 18 months after the start of transfers.
Definition: checks out.
Checklist: sub; Yes; pre; Yes; ecm; Yes;
Time: 5 mins
Claim: Growth is arguably the major driver of human progress.
re-write Claim: GDP per capita is the major driver of human
progress than others.
Note: I guess I could compare it with interventions, but that is difficult.
re-write Claim: Log GDP per capita is strongly correlated (>0.7) with many objective and subjective measures of welfare.
Example-sub:
| Variable (Objective or subjective)(o/s) | Correlation |
|---|---|
| Share of population with improved sanitation (o) | 0.83 |
| Child Mortality rate (o) | 0.79 |
| Literacy rate (o) | 0.74 |
| share of undernourished population(o) | 0.62 |
| self-reported life satisfaction (s) | 0.72 |
| Life expectancy (o) | 0.81 |
| Headcount poverty @1.96 dollar | - |
Definition: Checks out.
Checklist: sub; Yes; pre; Yes; ecm; Yes;
Time: 15mins
Claim: Proponents of RD rarely argue that the interventions that they recommend do increase growth.
re-write Claim: GiveWell top charity blog posts do not have the words “GDP” or “econom” in them.
Example-sub:
Malaria consortium blog post doesn’t have “GDP” or “econom” when searched for and neither does the one on AMF.
Definition: Checks out.
Checklist: sub; Yes; pre; Yes; ecm; Yes;
Time: 7 mins
re-write Claim: GiveWell Cost-effectiveness estimates do not have the words “GDP” or “econom” in them.
Example-sub:
GiveWell 2019 Cost-effectiveness Analysis, does not have the words “GDP” or “econom”.
Definition: Checks out.
Checklist: sub; Yes; pre; Yes; ecm; Yes;
Time: 7 mins.
Excursus on kinky poverty lines
RD might look like a plausibly effective way to reduce poverty, because of ‘kinky poverty lines’[18] — which define “extreme poverty” as living on less than
$1.90 per day, and then do not measure progress above that level. On this poverty line, directly funding RCT-backed aid could ‘pull people out of poverty’. Globally, around$180bn is spent on aid per year—roughly$500 million per day. There are 500 million people who are extremely poor. Assuming that all the extreme poor have$1 per day already, we could eradicate extreme poverty through cash transfers.
Claim: RD might look like a plausibly effective way to reduce poverty, because of ‘kinky poverty lines’.
re-write Claim: RD interventions could be an effective way to reduce poverty, if we use poverty line definition of “less than 1.9 USD a day”.
Note: based on the example the author gives, it appears he is checking if we can get eradicate poverty if we use the 1.9 USD per day poverty line.
re-write Claim: Available aid minus Aid (without losses in cash transfer) required to increase the income of below poverty line people to above poverty line, is >0.
Example-sub:
Example from the blogpost: “Globally, around 180bn USD is spent on aid per year—roughly 500 USD million per day. There are 500 million people who are extremely poor. Assuming that all the extreme poor have 1 USD per day already, we could eradicate extreme poverty through cash transfers.”
-
Assuming a 1
$per day already with the poor people and no losses in cash transfer of the aid reaching people. 700mn people are below poverty as of 2015. So we have700mn x 1$x 365 = 255bn. -
Total Available Aid per year amounts to 180bn
$. -
180bn-255bn is negative.
Definition: Does not check out.
Checklist: sub; Yes; pre; Yes; ecm; Yes;
Time: 45 mins (didn’t understand what kinky poverty lines meant for a 30 mins atleast., “could”, “effective way” and “because” throwing me off.)
Claim: RD do not measure progress above that level.
re-write Claim: One of the goals of UN is to reduce to zero people
living under 1.25 $ per day.
Example-sub:
“By 2030, eradicate extreme poverty for all people everywhere, currently measured as people living on less than $1.25 a day” —UN.
Definition: checks out.
Checklist: sub; Yes; pre; Yes; ecm; Yes;
Time: 5 mins
Claim: Directly funding RCT-backed aid could pull people out of poverty.
re-write Claim: Available aid minus Aid (without losses in cash transfer) required to increase the income of below poverty line people to above poverty line, is >0
Done earlier.
Claim: We could eradicate poverty through cash transfers.
re-write Claim: Available aid minus Aid (without losses in cash transfer) required to increase the income of below poverty line people to above poverty line, is >0.
Done earlier.
Claim: 500 million people are extremely poor in the world.
re-write Claim: 500m people are earning less than 1.9 USD/day.
Example-sub:
According to OWID, it is 700m people as of 2015.
Definition: Doesn’t check out.
Checklist: sub; Yes; pre; Yes; ecm; Yes;
Time: 5 mins
But this would raise their income by around
$1 per day. And someone on$2 per day is still very poor even if they are above the kinky$1.90 threshold. Indeed, this poverty line is discriminatory and would never be used for citizens in a high-income country: in the US, the poverty line is$17 per day.[19] There is no reason that such thresholds should not apply to people outside high-income countries. On this more expansive definition of poverty, it is very difficult for direct funding of programmatic aid to lift people out of poverty.
Claim: And someone on 2 USD per day is still very poor even if they are above the kinky 1.90 USD threshold.
Claim: Someone on 2 international dollars per day still cannot even afford more than a liter of milk and 1/2 a croissant.
Example-sub:
From WHO we gather that we can multiply the international dollar by the PPP exchange rate to get the local currency units.
2 USD per day translates to 1.36 euros (Netherlands). For this I will get 1 liter of milk and 1/2 croissant. How are you supposed to live on that per day. And what sort of a living would this even be? Let alone rent, insurance and other things.
2 USD per day translates to 42rs in India. For this you can have 1l of milk. Rent, health, education of children Who?
Definition: checks out.
Checklist: sub; Yes; pre; Yes; ecm; Yes;
Time: 60mins (got lost in understanding the conversion and PPP. Also getting lost in explaining very poor based on purchasing power.)
Claim: Poverty line is discriminatory.
re-write Claim: ratio of Poverty line in high-income countries and the international poverty line is >10 times.
Example-sub:
-
US poverty line 35
$in 2020 (12760$/365). -
International poverty line is at 2
$per day.
35/2 = 17
Definition: checks out.
Checklist: sub; Yes; pre; Yes; ecm; Yes;
Time: 15mins
Claim: Poverty line of 1.9 $ would never be used for citizens in
a high-income country.
re-write Claim: Poverty line of 1.9$ per day is not used in
high-income countries to determine eligibility for assistance
programs like Medicaid.
Example-sub:
For one person the 2018 US guidelines suggest 12,140$ per year as
the poverty threshold for assistance programs like Medicaid. This
amounts to 33.3$ per day.
Definition: checks out.
Checklist: sub; Yes; pre; Yes; ecm; Yes;
Time: 7 mins
Claim: There is no reason that such thresholds should not apply to people outside high-income countries.
re-write Claim: It’s not moral that such thresholds should not apply to people outside high-income countries.
Note: If all lives are equal irrespective of race caste or whatever, then the same poverty line should apply. but how is this an example. It’s just a “reason” and “explanation” that one accepts or not.
Failed
Claim: It is very difficult for direct funding of programmatic aid to lift people out of poverty, on this more expansive definition of poverty line.
re-write Claim: Cash transfers required per year is 10 times higher
with the case of eliminating higher poverty line of 35$ per day,
than 2$ per day.
Example-sub:
Assuming the world has 500million people in poverty.
| Poverty threshold | additional earnings | Aid required |
|---|---|---|
2$ per day |
1$ per day |
~180bn |
35$ per day |
34$ per day |
~6.1 tn |
Cash transfers at 35 $ per day would be 34 times higher assuming an
initial earnings of 1$ per day.
Definition: checks out.
Checklist: sub; Yes; pre; Yes; ecm; Yes;
Time: 10 mins
Claim: Indeed, median income, rather than direct anti-poverty programmes at a given level of income, predicts nearly all of the observed variation in poverty, at any poverty line:
re-write Claim: Median income predicts all of the observed variation in poverty at all poverty lines.
re-write Claim: R^2 value of non-linear fit ‘Median consumption’
vs ‘Headcount Poverty rate’ across countries with Median Annual
consumption <8000 USD, for different poverty lines (1.9, 3.2 and
5.5$), is greater than 90%.
Example-sub:
R^2 value of 98.3 to 98.8% is observed across the three poverty lines for a non-linear fit (-2 to power 5).
Source:figure 3 and pg9 from this paper
Definition: checks out.
Checklist: sub; Yes; pre; Yes; ecm; Yes;
Time: 10-15 mins (took time to write out the claim)
re-write Claim: Direct anti-poverty programmes at a given level of income, predicts all the observed variation in poverty, at any poverty line.
re-write Claim: Foreign aid received at a given level of
income across different countries predicts the headcount poverty
rate, at any poverty line.
re-write Claim: Linear R^2 value of Aid amount vs headcount poverty rate
across countries is <50%, at 1.9$ poverty line.
Note: I could have used non-linear fits and then made R^2, but as of now I don’t know how to do it.
Example-sub: There is not a direct graph on Our World In Data so, I will take 10 countries at random, fill out their Aid and headcount poverty rate and compute the linear R2 value.
| Country | Aid received per capita | Poverty headcount rate |
|---|---|---|
| Democratic Republic of Congo | 21.42 | 77.1 |
| Mozambique | 62.08 | 62.9 |
| Rwanda | 77.58 | 56 |
| Indonesia | 7.58 | 5.7 |
| Bangladesh | 18.57 | 14.8 |
| Laos | 74.61 | 22.7 |
| Madagascar | 17.44 | 77.6 |
| Ethiopia | 28.83 | 26.7 |
| Uganda | 41.11 | 41.6 |
| Gambia | 58.34 | 10.1 |
| Zambia | 53.02 | 57.5 |
Aid amount vs head count poverty rate has an R2 value of 0.4%.
Definition: checks out.
Checklist: sub; Yes; pre; Yes; ecm; Yes;
Time: 30 mins (extracting the data)
Figure 3
Direct anti-poverty programmes usually favored by proponents of RD, such as cash transfers, microfinance, or the graduation approach, aim to raise the income of the poor at a given level of national median income. However, differences across the country/years in the impact of these targeted poverty programmes conditional on the median account for at the very most 1.2 percent of the total cross-national variation in poverty rates.[20] This suggests that identifying the best direct anti-poverty programmes currently being implemented and scaling them up can at most have very limited low-bar poverty reduction benefits, unless these can be shown to increase national median income per head. There is no reason to think that many current RD programmes, such as cash transfers or the graduation approach, increase national median income.
Claim: Direct anti-poverty programmes (usually favored by proponents of RD), aim to raise the income of the poor at a given level of national median income.
re-write Claim: Cash transfers aim to increase the expenditure
capability of the poor at a given level of national median
income over time.
re-write Claim: Cash transfers increase the income of the poor at
a given level of national median income.
Note: I don’t have data on if the national median income changes or not So I look at it separately and fail.
Failed
Example-sub:
1000 USD was delivered to 10,500 households across 328 villages in Siaya, Kenya.
Expenditure has increased by USD PPP 293 (11.5% increase) 18 months after the start of transfers.
Definition: checks out.
Checklist: sub; Yes; pre; Yes; ecm; Yes;
Time: more than 60 mins trying to see what “at a given level of national median income” meant, by reading the paper.
re-write Claim: Cash transfers keep the national median income constant.
Note: no idea how to check or how to rewrite to test it.
Failed
Claim: Differences across the country/years in the impact of these targeted poverty programmes conditional on the median account for at the very most 1.2 percent of the total cross-national variation in poverty rates.
re-write Claim: Differences across countries in poverty headcount
rate in the impact of these targeted poverty programmes, accounts
for 1.2% of total cross national variation in headcount poverty rate,
when median consumption is held constant.
Note: I tried reading that part of the paper, and they mention 1.2% and they don’t seem to have a proper citation. They have a foot note and it doesn’t show what or where this 1.2% is coming from. Pg12.
Failed
Example-sub:
Differences across countries in poverty headcount rate @ median
consumption of 1000 units for 1.9$ poverty line –> 20 to 35% = 15%.
Example-pred:
Total cross national variation in headcount poverty rate is 100% as countries vary in poverty rates are from roughly 0 to 100%.
Definition: Doesn’t check out. 15% != 1.2%
Checklist: sub; Yes; pre; Yes; ecm; Yes;
Time: 2 hrs
Note: However, if we look at the “impact of targeted poverty programmes”, then they pretty much attack countries with high poverty rate > 0.35 (Kenya, Liberia cash transfers). Factoring this into the following claim.
re-write Claim: Differences across countries in poverty headcount rate accounts for 1.2% of total cross national variation in headcount poverty rate, when poverty headcount rate is higher than 35% and median consumption is held constant.
Example-sub:
Differences across countries in poverty headcount rate @ median
consumption of 750 units (where poverty rate is > 35%) for 1.9$
poverty line is between roughly 50 and 53% –> = 3%.
Example-pred:
Total cross national variation in headcount poverty rate is 100% as countries vary in poverty rates are from roughly 0 to 100%.
Definition: Doesn’t check out. 3% != 1.2%
Checklist: sub; Yes; pre; Yes; ecm; Yes;
Time: 30mins (realizing that I might after all know what the author could have meant)
Claim: This suggests that identifying the best direct anti-poverty programmes currently being implemented and scaling them up can at most have very limited low-bar poverty reduction benefits, unless these can be shown to increase national median income per head.
Note: We can only comment on what is observed. What is observed is for a given median annual consumption the head count poverty rate doesn’t vary too much (15% max). But this variation at a given consumption is lower (around 3% max) for poverty rates in the order of 35 to 50%, which is where Give Directly does its cash transfers intervention. So if we look at a median consumption around 750 units in the same graph Figure 3, then we see <5%.
re-write Claim: Differences in headcount poverty rate observed at a constant median annual consumption of 750 units is <20%.
Example-sub:
At 750 units of median consumption, we see that the headcount poverty
rate of line 1.9$ is less than 5%.
Definition: checks out.
Checklist: sub; Yes; pre; Yes; ecm; Yes;
Time: 15 mins.
Claim: There is no reason to think that many current RD programmes, such as cash transfers or the graduation approach, increase national median income.
Note: Not sure how to check if the median income will stay the same if there is cash transfer or not. Don’t have direct data atleast.
Failed
From the paper
This of course doesn’t mean that other factors like the change in the inequality or the adoption of “poverty” programs cannot make a difference or even that they cannot in principal make a “substantial” difference, it just says that empirically, relative to the massive changes associated with the change in the median (from poverty of 100 percent to near zero percent), the differences at a given level of consumption are very modest compared to the gains from growth.
The part on “inequality” is being skipped as that is not what I want to test in this paper.
Claim: Relative to (the massive changes associated with the change in the median)[1], the (differences at a given level of consumption)[2] are very modest compared (to the gains from growth)[3].
Note: These are some of the most convoluted sentences I have ever seen. After half an hour of pondering over this sentence, I think I get it… I think “relative to [1]” and then “compared to [3]” seems to mean the same thing. There are also typos (closure of brackets missing) which make me wonder what sort of publication this is. I suspect this “paper” was even proof read.
re-write Claim: Relative to [1], [2] of the poverty headcount rate, compared to changes in poverty headcount rate when median consumption changes, is very modest (>10%).
Example-sub:
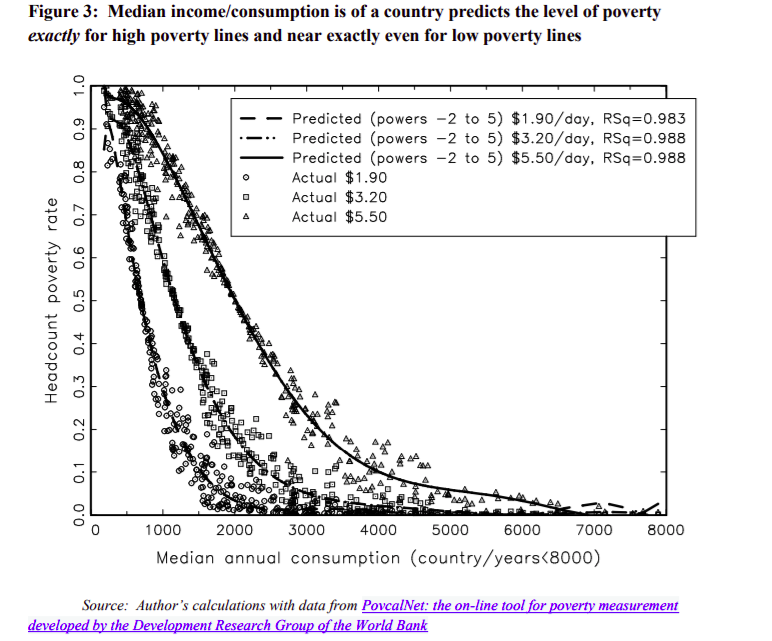
[1] –> If median annual consumption changes from 0 to 8000 units then headcount poverty rate goes from 100% to 0%.
[2] –> At any median annual consumption, for 1.9$ poverty line, the
variation of headcount poverty rate is at max 15%.
changes in poverty headcount rate when median consumption changes –> It seems to be the same as [1].
Definition: Checks out that [2] is modest based on the empirical evidence.
Checklist: sub; Yes; pre; Yes; ecm; Yes;
Time: 40 mins
Note: Back to blogpost.
This is not to say that decreasing inequality is not important: as we saw above, inequality can have large effects on a country’s welfare per person.
Claim: inequality can have large effects on a country’s welfare per person.
re-write Claim: GINI index is strongly (>abs(0.7)) correlated with GDP per capita.
Example-sub:
In 2013 the correlation between GINI index and log GDP per capita is -0.6.
Definition: Doesn’t check out.
Checklist: sub; Yes; pre; Yes; ecm; Yes;
Time: 15 mins (getting data and finding the parameter to check with)
Success of development era
The story of human welfare is well illustrated by this graph
Claim: the story of human welfare is “well illustrated” by this graph.
re-write Claim: Most of the World GDP per annum increase, happens in the last 200-250 years.
Example-sub:
Last 200 years, GDP per annum increase 100tn USD (@1820 World GDP was at 1.2tr USD. @2013 it is >101tn USD).
From 0 to 1800, GDP per annum increase by 1tn.
Definition: checks out.
Checklist: sub; Yes; pre; Yes; ecm; Yes;
Time: 10 mins
Feedback: missed “per annum”
Until 1800, average human welfare was stagnant, but after the Industrial Revolution, living standards exploded. This preceded most development economics. However, the end of the Second World War marked the start of what Pritchett calls the ‘development era’ with:
- The end of colonization with the liberation of India, Pakistan and Indonesia
- The founding of the Bretton Woods institutions - the IMF and the World Bank
- Truman’s Four Point plan to provide technical assistance to developing countries
- Overall a concerted effort by economists and sovereign states to increase development[21]
Claim: Until 1800 average human welfare was stagnant.
re-write Claim: Until 1800 World GDP per annum was <2 tn USD.
Example-sub:
Before 1820, World GDP per annum was 1.2tn for over 1800 years.
Definition: checks out.
Checklist: sub; Yes; pre; Yes; ecm; Yes;
Time: 5 mins
Feedback: Missed “per annum”
Claim: After industrial revolution, living standards exploded.
re-write Claim: World GDP annum increase from 1840 to 1940
(industrial revolution was much larger (>10 times) than GDP per annum
increase from 1740 to 1840
re-write Claim: World GDP per annum after 100 years after 1840 was 10 times greater than 100 years before 1840.
Example-sub:
GDP per annum at 1940: ~9.25tn$
GDP per annum at 1740: ~750bn$
=> > 10 times
Definition: checks out.
Checklist: sub; Yes; pre; Yes; ecm; Yes;
Time: 5 mins.
note to self: rewrote claim during 2nd read through.
Claim: This preceded most development economics.
re-write Claim: Industrial revolution preceded most development economics.
re-write Claim: Industrial revolution preceded the green revolution.
re-write Claim: 1760-1840 preceded the Mexican Agricultural program.
Example-sub:
1712: Invention of steam engine.
1943: Mexican agricultural program begins—wiki.
Definition: Checks out.
Checklist: sub; Yes; pre; Yes; ecm; Yes;
Time: 30 mins (figuring out some way to test “most development economics”)
Claim: the end of the Second World War marked the start of what Pritchett calls the ‘development era’ with The end of colonization with the liberation of India, Pakistan and Indonesia.
re-write Claim: End of second World War preceded the start liberation of India, Pakistan and Indonesia.
re-write Claim: Year in which Germany and Japan surrendered to Allies (WW2) preceded the year of independence of India, Pakistan.
Example-sub:
1945: Year in which Germany and Japan surrendered
1947: end of British rule in India/Pakistan
Definition: checks out.
Checklist: sub; Yes; pre; Yes; ecm; Yes;
Time: 15mins (learning about WW2)
Claim: the end of the Second World War marked the start of what Pritchett calls the ‘development era’ with founding of Bretton Woods Institutions.
re-write Claim: Year in which Germany and Japan surrendered to Allies (WW2) and the year of founding of the Bretton Woods Institutions was within 1 year.
Example-sub:
1945: Year in which Germany and Japan surrendered
1944: Year of founding of the Bretton Woods Institutions
Definition: checks out.
Checklist: sub; Yes; pre; Yes; ecm; Yes;
Time: 5mins
Claim: the end of the Second World War marked the start of what Pritchett calls the ‘development era’ with Truman’s Four Point plan to provide technical assistance to developing countries.
re-write Claim: Year in which Germany and Japan surrendered to Allies (WW2) preceded the Trumans inaugural address on plan for developing countries.
Example-sub:
1945: Year in which Germany and Japan surrendered
1949: Inaugural Address of Truman’s four point program for developing countries
Definition: checks out.
Checklist: sub; Yes; pre; Yes; ecm; Yes;
Time: 5mins
Claim: The end of the Second World War marked the start of what Pritchett calls the ‘development era’ with Overall a concerted effort by economists and sovereign states to increase development[21].
re-write Claim: Year in which Germany and Japan surrendered to
Allies (WW2) was few years within when the Mexican agricultural
program began.
re-write Claim: Year in which Germany and Japan surrendered to Allies (WW2) was few years within the founding of the Bretton Woods Institution.
Example-sub:
1945: Year in which Germany and Japan surrendered
1944: Year of founding of the Bretton Woods Institutions
Definition: Checks out.
Checklist: sub; Yes; pre; Yes; ecm; Yes;
Time: 10 mins
The development era was a huge success: since 1950, human welfare has improved on all objective measures by more than all prior human history combined.[22] On the chart below, countries can move vertically up from the diagonal line (meaning that they had positive growth), or vertically down from the diagonal line (meaning that they had negative growth).
Claim: The development era was a huge success.
re-write Claim: GDP per capita per annum increase from 0 to 1950 was 5 times smaller than 1950 to 2010.
Example-sub:
0-1950: 9.2tn$
1950 to 2010: 76tn$
76/9.2 = 8.2
Definition: checks out.
Checklist: sub; Yes; pre; Yes; ecm; Yes;
Time: 15 mins.
Claim: Since 1950, human welfare has improved on all objective measures by more than all prior human history combined.[22]
Note: Instead of doing all objective measures, we just look at Life expectancy.
re-write Claim: Life expectancy of world increase from 1770 to 1950, was smaller than 1950 to 2010.
Example-sub:
-
1770: 28.7 years
-
1950: 47.5 years
-
2010: 69.5 years
-
1770 to 1950 –> 18.8 years in 180 years
-
1950 to 2010 –> 22 years in 60 years.
Definition: checks out.
Checklist: sub; Yes; pre; Yes; ecm; Yes;
Time: 10 mins (mining the data)
Claim: Countries can move vertically up from the diagonal line (meaning that they had positive growth), or vertically down from the diagonal line (meaning that they had negative growth) (while pointing at this graph).
re-write Claim: Many countries have had positive GDP per capita per annum increase from 1950 to 2016 and some countries have had -ve GDP per capita increase from 1950 to 2016.
Example-sub:
More than 100 countries seem to have had positive growth since 1950.
Around 9 countries have had negative growth since 1950.
Definition: checks out.
Checklist: sub; Yes; pre; Yes; ecm; Yes;
Time: 15mins
It is important to note that the development era was not all plain sailing and that there have been some major growth decelerations, as we discuss below. Nevertheless, the net effect of the era has been overwhelmingly positive.
Claim: It is important to note that the development era was not all plain sailing and that there have been some major growth deceleration’s.
re-write Claim: It is important to note that the dev era was not all plain sailing.
Note: important? how to deal with this?
re-write Claim: Development era was not all plain sailing.
re-write Claim: There have been some major growth deceleration’s.
re-write Claim: Some countries have had negative growth since 1950.
Example-sub:
Zimbabwe, Democratic Republic of Congo, Central African Republic, Burundi, Niger etc… all have ratios of 2010 GDP per capita vs 1950 GDP per capita as less than 1.
Definition: checks out.
Checklist: sub; Yes; pre; Yes; ecm; Yes;
Time: 10 mins
Claim: Nevertheless, the net effect of the era has been overwhelmingly positive.
re-write Claim: Ratio of countries with positive GDP per capita per annum growth and negative GDP per capita per annum decrease is >10, for period 1950 to 2010.
Example-sub:
Atleast 110 countries with net positive GDP per capita.
9 countries with net negative GDP per capita.
Definition: checks out.
Checklist: sub; Yes; pre; Yes; ecm; Yes;
Time: 10 mins.
If things are going so well, why would we start working on a completely different form of development economics? It seems like the best course would be to broaden and accelerate this process globally, and replicate previous successes. Moreover, the failures that do exist seem to make the case for improving our knowledge of growth and the likelihood of policy success. (We discuss this in more detail below).
Claim: It is not a good idea to work on a completely different form development economics, when things are going so well.
Note: Not sure how to test “not a good idea” with current evidence base.
Failed
time: 20 mins (“Failed”)
re-write Claim: Things are going so well with the current form of dev econ.
re-write Claim: Most countries with positive growth since 1950 have grown 2x richer atleast.
Example-sub:
Out of atleast 110 countries with +ve growth, it appears that 97 countries are 2x richer since 1950 in terms of GDP per capita.
Definition: checks out.
Checklist: sub; Yes; pre; Yes; ecm; Yes;
Time: 10 mins
Claim: It seems like the best course would be to broaden and accelerate this process globally, and replicate previous successes.
Note: Unsure how to test “best course of action” and “accelerate process globally”, “replicate previous successes”.
failed
Claim: Moreover, the failures that do exist seem to make the case for improving our knowledge of growth and the likelihood of policy success.
Note: How to test “X makes the case for Y”.
failed
re-write Claim: Failures do exist of the dev eco era.
re-write Claim: Some countries have had negative growth since 1950.
Example-sub:
Zimbabwe, Democratic Republic of Congo, Central African Republic, Burundi, Niger etc… All have ratios of 2010 GDP per capita vs 1950 GDP per capita as less than 1.
Definition: checks out.
Checklist: sub; Yes; pre; Yes; ecm; Yes;
Time: 1 mins (copied from above)
RD has moved in an entirely different direction. Instead of replicating this success, it asks: among interventions that we can test with RCTs, what is most impactful? In the wake of the period with by far the greatest progress in human welfare of all time, this change in strategy is difficult to justify.
Claim: RD has moved in an entirely different direction.
re-write Claim: RD is not trying to replicate what happened from 1950 to 2010.
re-write Claim: GiveWell does not recommend any intervention which involves “trade liberalization”.
re-write Claim: GiveWell does not recommend any intervention based on Trade.
Note: I guess “based on X” is not testable. Correct? So would need to make it “more concrete” somehow?
Example-sub: GiveWell top recommended charities are focused on Deworming and malaria.
Definition: checks out
Checklist: sub; Yes; pre; Yes; ecm; Yes;
Time: 15 mins (Struggled to find a way to test “what happened from 1950 to 2010”)
re-write Claim: RD trying to do other things instead.
re-write Claim: GiveWell recommends interventions on Deworming and malaria.
Example-sub: GiveWell’s top recommended charities are Malaria consortium, Deworming The World etc…
Definition: checks out.
Checklist: sub; Yes; pre; Yes; ecm; Yes;
Time: 2 mins
Claim: RD doing other things is difficult to justify.
re-write Claim: Deworming the world has no clear evidence on GDP per capita.
re-write Claim: Deworming The World has no clear evidence on being the best way to increase GDP per capita.
re-write Claim: Deworming the world does not improve long term income (let alone GDP per capita).
Note: If Deworming The World does not improve “long-term” income then, we can say that the author of the blog post “finds it difficult to justify”. I tried understanding the paper that explained it but it was all too much. I didn’t understand and it was too long to read every sentence. Skimming for results didn’t help.
re-write Claim: GiveWell does not believe that Deworming The World improves the long term income.
Example-sub:
“However, after further investigation and updates based on new data, we no longer believe that these studies provide substantial support for the theory that deworming has long-term impacts. “—GiveWell
Definition: checks out.
Checklist: sub; Yes; pre; Yes; ecm; NO;
Time: 40 mins (mainly trying to read the paper and see if I can use it to inform the presence of weak evidence).
As a way to guide the comparison with RD, it is interesting to compare this progress with the estimated effect of Deworming. Of GiveWell’s top charities, Deworm the World is estimated to offer the most cost-effective way to improve economic outcomes for the very poor. But given the story above, it would be very surprising if this was the case: differences in rates of deworming explain a minuscule fraction of the variation in individual economic outcomes across the world. No-one argues that deworming is among the top 1000 causes of the huge economic transformation documented above.
^^ is arguably the hardest paragraph to do this excercise.
Claim: It is interesting to compare “this” progress with the estimated effect of Deworming.
re-write Claim: Estimated increase in GDP per capita from 2000 to 2010 is 1000 times higher than estimated GDP per capita as a result of Deworming.
Note: I could make an estimate on GDP per capita if I had an estimate on the income gains. But reading the paper for income gains was “hard”. and the paper is being “disqualified” as evidence by GiveWell. Not sure how to proceed as a result. Also, there re no cost-effectiveness estimates for “this” progress.
Failed
Claim: Deworm the World is estimated to offer the most cost-effective way to improve economic outcomes for the very poor.
re-write Claim: Deworming The World is estimated to be the most
cost-effective program from GiveWell’s top charity recommendations
to improve economic outcomes for the very poor
Note: not sure where the author got his source from. There are no citations to such claims.
Example-sub:
Deworming The World has a cost-effectiveness of 67, while Bednets has 17, VAS has 15, SMC has 16, and Deworming Sightsavers has 9 (all compared to “cash” transfers).
Definition: checks out.
Checklist: sub; Yes; pre; Yes; ecm; Yes;
Time: 5 mins.
Claim: It would be very surprising if “differences in rates of deworming explain a minuscule fraction of the variation in individual economic outcomes across the world.”
Note: Not sure how to test –> “It would be surprising”?
Failed
re-write Claim: Differences in rates of deworming explain a minuscule fraction of the variation in individual economic outcomes across the world.
Note: Connecting deworming to GDP per capita and saying they don’t help in world GDP increase: I don’t know how to test this. I could make an estimation based on how many people it is expected to reach, with some adjustment factors etc… It would take time. I can’t quickly test it.
Failed
Claim: No-one argues that Deworming is among the top 1000 causes of the huge economic transformation documented above.
re-write Claim: GiveWell does not suggest that deworming helps increase long-term income.
Note: “suggest”? I guess it not ok to test.
Failed
Moreover, given that GiveWell estimates that Deworming has similar impact on welfare (broadly conceived) to their other top charities, this should lead us to question whether their other top charities are the best way to increase human welfare, broadly conceived.
What do you expect me to do here? Can you give an example?
The part with Deworming The World was really painful.
Failed
Cost-effectiveness analysis: RD vs. Growth
Though growth is a major determinant of human welfare today, it does not follow that research and advocacy for growth and national development are more cost-effective than RD interventions. While the payoff might be large, the probability of influencing policy, or the probability that you know better than policymakers, might be low enough to make the expected value of such work lower than RD.
Claim: Growth is a major determinant of human welfare today.
re-write Claim: GDP per capita is strongly correlated with “expanded welfare metric”.
Example-sub:
0.96
Definition: checks out.
Checklist: sub; Yes; pre; Yes; ecm; Yes;
Time: 5 mins
Claim: It does not follow that research and advocacy for growth and national development are more cost-effective than RD interventions.
re-write Claim: research and advocacy for growth and national development are more cost-effective than RD interventions.
re-write Claim: Ratio budget of world bank (over X years) to the increase the GDP of country Y (due to world bank) is “orders of magnitude” greater than the cost-effectiveness of Graduation approach.
Note:Didn’t get far enough with the text with the blogpost to be able to answer this claim.
Claim: While the payoff might be large, the probability of influencing policy, or the probability that you know better than policymakers, might be low enough to make the expected value of such work lower than RD.
re-write Claim: Probability of “influencing policy” is less than 1%.
re-write Claim: Expected cost-effectiveness of “work to influence policy” is lower than the expected cost-effectiveness of Graduation approach.
Note:Didn’t get far enough with the text.
Time: 5 mins (“might”, “expected costs”, “probability”)
Pritchett has a convincing response to this argument. He compares a popular form of RD, the Graduation approach, with research on and advocacy for growth.
Note: This is like a summary of the rest. So skip this.
The Ultra Poor Graduation program gets people out of extreme poverty via livelihood training, productive asset transfers, consumption support, savings plans, and healthcare. It is one of the most well-tested and impactful direct anti-poverty programs. (Founders Pledge research suggests that Bandhan, a charity carrying out the Graduation approach, is 5x a cost-effective as cash. GiveWell estimates that Malaria Consortium is 15.8 times as cost-effective as cash. Thus, it seems fair to roughly assume that Malaria Consortium is around 3 times more cost-effective than the Graduation approach.)
Claim: The Ultra Poor Graduation program gets people out of extreme poverty via livelihood training, productive asset transfers, etc…
re-write Claim: Average income for all countries in the
Graduation program year graduation program is <1.9$ PPP per day.
Example-sub:
For Pakistan the eligibility criteria is <1.74$ PPP. But for
Honduras the eligibility criteria seems to be <2.18$ PPP per day
(67.82$/31). For other countries, it’s not even based on income.
Definition: Does not check out.
Checklist: sub; Yes; pre; Yes; ecm; Yes;
Time: 30 mins (Finding evidence was taking time. Mainly reading and extracting info from the papers.)
re-write Claim: Average income after third year of graduation
program is >1.9$ PPP per day.
Note Average income not available. So we look at consumption due
to the program. If it is greater than 1.9$ PPP per day.
re-write Claim: Consumption per person “attributed to the
program over the control” is > 1.9$ PPP per day.
Example-sub:
Let’s take Pakistan and in third year (one year after the stopping of the intervention):
Non-durable annual consumption “as a result of the program per household” = 451 USD PPP.
Assuming 2 people even per household, this becomes 451/365/2=0.61$
PPP per day.
Definition: Doesn’t check out.
Checklist: sub; Yes; pre; Yes; ecm; Yes;
Time: 120 mins (“reading paper and figuring out usable values”)
Claim: It is one of the most well-tested and impactful direct anti-poverty programs.
re-write Claim: Graduation program is “one of the most” impactful direct anti-poverty programs.
re-write Claim: Graduation program is one of the most more
cost-effective than Cash transfers.
Example-sub:
Bandhan’s Graduate program is 5x as cost-effective as Cash Transfers (according to Founders Pledge an organization that does not believe in citations or transparency).
Definition: checks out.
Checklist: sub; Yes; pre; Yes; ecm; Yes;
Time: 15mins
Claim: Thus, it seems fair to roughly assume that Malaria Consortium is around 3 times more cost-effective than the Graduation approach.
Note: Not sure how to test “seems fair to assume something”. If I remove that then it can be tested.
A range of RCTs in different contexts have shown that the Graduation approach raised year 3 incomes in 5 out of 6 study sites. The study suggests that the intervention on average produces a 1.6x return in net present value.[23] Thus,
$1000 invested in the intervention would produce$1,600 in net present value. There are around 100 million people in Ethiopia, so$1 billion invested in the graduation approach there would increase per capita income by$16.
Claim: A range of RCTs in different contexts have shown that the Graduation approach raised year 3 incomes in 5 out of 6 study sites.
re-write Claim: 6 RCTs in different countries have shown that the Graduation Programme raised year 3 consumption in 5 out of 6 sites “compared to control group”.
Note: I don’t know how they obtained the “effect size” of consumption compared to the control group. So it is a black box for me and hence the “”.
Example-sub:
According to this paper which summarizes the results of 6 RCTs in different countries, Table 4 Line 6 shows Year 3 non-durable annual consumption due to the program is +ve for 5 sites out of 6 with the exception being that of Honduras (-ve).
Definition: checks out.
Checklist: sub; Yes; pre; Yes; ecm; Yes;
Time: 10 mins
Compare this to the per-person value of growth accelerations and decelerations documented by Pritchett et al (2016). These are defined as the change in output per capita resulting from one structural break in the trend growth of output to the next. These acceleration or deceleration typically range from 10 to 30 years. The per person benefits (costs) of these growth accelerations (decelerations) are orders of magnitude greater than the impact of the Graduation programme:[24]
Time: Spent 10-15 hours trying to understand the “growth acceleration”, “NPV”, “ppa” and how these are calculated in the paper and reproducing them to check understanding.
Claim: Per person “benefits of growth accelerations” are orders of magnitude greater than the per-person potential impact of graduation programme.
re-write Claim: GDP per capita increase due to the “Black-box growth acceleration” is one order of magnitude higher than potential GDP per capita increase of graduation programme.
Note: The following example as given in blog post and elaborated by me the first time is a BIG FAIL for the above claim. Benefits are compared but not for same costs. Sad part is I said it checks out the first time. And realized about it while re-reading it. I then edit the claim so that atleast the example matches the claim.
Failed
re-write Claim: GDP per capita increase due to “growth
acceleration” from 1967 to 1980 (irrespective of the cost it took to
get there), is one order of magnitude higher, than potential GDP per
capita increase of graduation programme for a cost of 1bn $.
Note: The above claim compares GDPPC increase in graduation
programme for 1bn $ and “black-box growth accelerations” (not per
1bn $). This is what the author seems to be saying, and the
following just tests that. I understand that this is a bullshit
comparison.
Example-sub:
-
Potential GDP per capita increase of graduation programme in Ethiopia:
-
Dollars in benefit to cost ratio is 1.6 times on average. (Table 4 line 11)
-
Ethiopian population is 100 million.
-
Investing 1billion USD could get a per capita increase of 16
$per year. -
Whereas GDP per capita increase due to “black-box growth acceleration” in the past for Brazil in 1967.
-
“Per capita gain per annum in NPV of GDP from a single large growth acceleration” = 551
$in Brazil around 1967 (Table 4). -
551/16 = 34 times
Definition: checks out.
Checklist: sub; Yes; pre; Yes; ecm; Yes;
Time: 10 mins
Note: Picked up some claims from the paper (as below) while trying to understand the blogpost.
Claim: Growth accelerations happened in Brazil in 1967.
“an acceleration in 1967 (in Brazil) in which growth increased from 4.16 to 5.16 ppa… These acceleration and deceleration years create four episodes of growth (1950–1967, 1967–1980, 1980–2002 and 2002– 2010). “—Section 2.4 on Brazil
re-write Claim: From 1950 to 1967 the “growth” was 4.16 ppa in Brazil.
re-write Claim: From 1950 to 1967 the regression slope of log GDP per capita in Brazil vs years was 4.16% +-0.5%.
Example-sub:
Using data from Our World In Data which is “slightly” different from the data used in the paper (e.g., Figure 6 1968 value of GDP is 8.7 in Our World In Data and 8.35 in the paper):
Slope of regression 3.86%.
Definition: checks out
Checklist: sub; Yes; pre; Yes; ecm; Yes;
re-write Claim: From 1967-1980 the the “growth” was 5.16 ppa in Brazil.
re-write Claim: From 1950 to 1967 the regression slope of log GDP per capita in Brazil vs years was 5.16% +-0.5%.
Example-sub:
Using data from Our World In Data:
Slope of regression 5.01%.
Definition: checks out.
Checklist: sub; Yes; pre; Yes; ecm; Yes;
re-write Claim: Growth accelerations happened in 1967.
re-write Claim: Slope of regression between log GDP per capita vs years in Brazil increased from [1950-1967] and [1967-1980].
Note: I didn’t delve into how these year brackets come about. I assume the author has his reasons for now and roll with it.
Example-sub:
1950-1967 –> 3.86%
1967-1980 –> 5.01%
Definition: Checks out.
Checklist: sub; Yes; pre; Yes; ecm; Yes;
time: -
Claim: “Growth accelerations” end up with trillions of dollars NPV.
re-write Claim: Growth increase in % compared to counterfactual in 1967 over the entire growth period (using discount rate of 5%).
re-write Claim: Net present Value in 1967 of Actual GDP per capita minus PRM GDP per capita for period [1967 to 1980] in Brazil is in trillions of dollars.
Example-sub:
Actual GDP per capita from 1980 to 2002 from : data
PRM GDP per capita computed from 2.87 ppa: From the paper itself. Not going to go into calculating this. Just accept the value for now.
Net Present Value of Actual minus PRM is calculated as follows:
$\sum_{n=1}^{n=22} \frac{1}{1+r^n} (GDP_{actual} - GDP_{PRM})$ .
This is in GDP per capita. If we multiply this with 88mn (population of Brazil in 1967), then we get +ve 1 tn USD.
Definition: checks out.
Checklist: sub; Yes; pre; Yes; ecm; Yes;
Time: 10 mins
re-write Claim: Loss of 7.5 trillion dollars from 1980 to 2002 for Brazil.
re-write Claim: Net Present Value in 1980 of Actual GDP per capita minus PRM GDP per capita from 1980 to 2002 in Brazil is -ve 7.5 +-2 trillion dollars.
Example-sub:
Actual GDP per capita from 1980 to 2002 from : data
PRM GDP per capita computed from 4.5 ppa: From the paper itself. Not going to go into calculating this. Just accept the value for now.
Net Present Value of Actual minus PRM is calculated as follows:
$\sum_{n=1}^{n=22} \frac{1}{1+r^n} (GDP_{actual} - GDP_{PRM})$.
This is in GDP per capita. If we multiply this with 120mn (population of Brazil in 1980), then we get -ve 6 tn USD.
Definition: checks out.
Checklist: sub; Yes; pre; Yes; ecm; Yes;
Time: 90 mins (tough one with piecing all the pieces together trying to split the claim etc…)
Claim: Largest growth acceleration produce total benefits in the hundreds of billions of dollars in net present value.
I think this is done… But I want to get to NPV trillions. For now I have reproduced the growth rates and counterfactual I have assumed and next I want to move on to other things…
Statistics
Time: 166 hrs (roughly 2 months of work)
Time/day: 2.98 hrs
Words: 27k words
Claims worked out with one example: 209
Feedback from the previous post
In the following discussion, I have not used “for a given pay” as I don’t have any examples for them. Similarly, certain positions such as director of operations or fundraising people are not considered as I don’t have evidence for it.
For future reference, glassdoor.com has salary data points. For example, https://www.glassdoor.com/Salary/Centre-for-Effective-Altruism-Salaries-E771486.htm.
Number of “good quality” people … Looking at the acceptance rates it appears that EA Orgs are hard to get in just like the top Universities. I am unsure anything related to the number of “good quality” people can be derived from here.
Need to further break down “number of ‘good quality’ people”. Are we talking about (a) the number of people in the world with a certain level of qualification (say, PhD in Economics and 2 years of work experience), whether or not they work in one of the EA organizations, (b) the number of people who applied for a particular job posting, or (c) the number of people who were hired?
(What is this “quality” you speak of?)
EA Orgs seem to think that there are more candidates fit for the job than the ones they hired in research. OPP said they got more than 100s of good resumes for the GR positions. In the end they thought multiple people from the pool who didn’t make it, would exceed at OPP in the future.
EA orgs seem to think that there are NOT many candidates fit for the job than the ones they hired in Entrepreneurship. CE had ~20 positions and were able to fill only 17 in 2019. But in 2020 with more than 10 times the applications as in 2019, it is probable that they have more “acceptable” candidates than the people they hire.
What they say and think about the number of candidates fit for the job is different from the number of people hired or the other claims we saw above. Stick to one claim at a time. See what happens when you don’t try to test the claim “holistically”.
Funding: Short on cash to hire people
Meta Orgs don’t seem to be affected by funding while considering hiring researchers. OPP said, “our current ability to immediately assess and deploy this base of available talent is weak”. It is not clear if hiring is affected by funding in Longtermism Orgs. There is not info I can find regarding this on MIRI for example.
short on cash”? “affected by funding”? “ability to immediately deploy available talent is weak”?
Unfortunately, my dictionary is defective and seems to have omitted those words, so I’m having a hard time following this.
How are you supposed to test the claim that someone is “short on cash”? He didn’t hire a million people? Even Bill Gates didn’t hire a million people.
Contrast that to: this year’s hiring budget. Even if that number is not directly available, you could look at related numbers like last year’s expenditure on salaries and other overhead, last year’s funds raised, and thus whatever surplus amount they have for hiring this year (this is one way people may decide their hiring budget; they may also look at their projected funds raised this year, etc.). Example: MIRI budget breakdown - https://intelligence.org/2019/12/02/miris-2019-fundraiser/.
So, one way to look at claims of “funding-constrained” is to see the growth in budget and check if there was a surplus compared to last year and if more of that went into hiring new employees or if it went into higher salaries for existing employees, administrative costs (like managers or accountants), and higher rent for a bigger office.
Why does this matter? If someone’s projected budget is not higher than last year’s, then he probably doesn’t have much budget for hiring new employees. In that case, I would predict that donating more would probably lead to more hires and thus hopefully more impact (SST). But if his projected budget is higher and he still doesn’t allocate much for new hires, then I wouldn’t expect to see more donations to lead to more hires and more I-word. Much of that money might go into higher salaries or a bigger office (which may or may not lead to less I-word but will probably be different from that for new hires).
PH representing RP, RC, CS says,
I personally feel much more funding constrained / management capacity constrained / team culture “don’t grow too quickly” constrained than I feel “I need more talented applicants” constrained.
WTF.
However, orgs in GH&P hiring for entrepreneurship don’t seem to be short on cash. CE (via mail) says that, they were not having any issues with money, but suggest that this year (2020) the situation might be different due to the 10 times more applications.
“issues with money” vs “budget for new hires”
Whether you are a new or an old org you seem to want money to get more hires. RP is a new org (founded in 2018) and would like money to get more hires, but so does TLYCS (founded in 2010) and the whole RC (2013) CS franchise according to Peter which were founded many years ago.
This is answering a different kind of question from the question for this section. This is about “does the age of the organization affect how much they ‘seem to want money’?” But the question for this section was “are they ‘short on cash’?” #SeparateThyClaims
Some Longtermism Orgs are unable to meet their fundraising targets as small as 1m
$.
“Longtermism”??
Time spent
Total time: 48 hrs (Over 2 weeks) + 9 hrs (another edit after sending it to an STM) Total words: 4700
Number of days: 13 Avg hrs per day: 3.6hrs (including weekends and 2 full days)
Lovely. Keep up the great work, Mr. Agent. 3.6 hours per day calls for a nice celebration (alcohol or whatever you prefer as a treat). Here’s to several thousand hours more.
Mission #7: Here’s your mission, should you choose to accept it - take up some passage that has confused you (could be about work, politics, EA, or AI), narrow down its claims, and test them with one concrete example each. The output dimensions for each claim would be whether you have a concrete example for the subject and the predicate and whether the example actually talks about the same thing as the claim (survey vs acceptance rate).
The twist is that you have to rewrite the sentence till the claims without concrete examples are gone. For example, “we are short on cash” will become “we have zero budget for new hires this year” plus example.
Important takeaways
So we have the claim, “GiveWell don’t seem to be affected by funding while hiring researchers”. Let’s say it is expected to test this against EE and not with statements such as: “OPP didn’t want to hire in that round because of …”. Then, I see the problem. I can’t test the statement. SS Hurts.
Let’s try another,
Claims: GiveWell “don’t want” to hire more researchers not
because of funding issues despite “having enough funding”.
Note: Even this is not good. SS is still hurting like hell “don’t want to hire more researchers”, “despite having enough funding”.
re-write Claim: GiveWell do not allocate more funding money in
budget than previous year for hiring, despite allocating “more” funds
to other things like bigger office, higher salaries etc…
Note: This seems to be testable by checking budget as an STM has informed. Ufff! that took time to get to.
re-write Claim: GiveWell does not allocate more money in budget than previous year for hiring.
Example-sub:
GiveWell 2019 salary expenses: 3.1m USD
GiveWell 2018 salary expenses: 1.9m USD
2019 Salary > 2018 Salary
Definition: Does not check out.
Checklist: sub; Yes; pre; Yes; ecm; Yes;
re-write Claim: GiveWell allocates more money in its budget for Rent.
Example-sub:
GiveWell 2019 Occupancy expenses: 119k USD
GiveWell 2018 Occupancy expenses: 23k USD
2019 expenses > 2018 expenses
Definition: checks out.
Checklist: sub; Yes; pre; Yes; ecm; Yes;
Lessons: Make claims testable by removing the fluff (“affected by funding”). Agent is struggling with complicated claims (“affected by funding”). As soon as you change that complicated part, you can modify the claim to make it testable (as shown above).
Notes to an STM
I assumed we don’t talk about anything less than 200 claims. The above format is what I try to keep up with along this excercise:
-
Main claims –> “Claim:”
-
sub claims –> “re-write Claim:”
-
sub claims rewritten –> re-write Claim:
-
Line donates the end of a “Claim:”, not a “re-write Claim:”
-
All “Because” claims are skipped as that is not the goal here. “Because” is removed and the claim is treated regularly.
For e.g.,
Claim: Most developing countries are substantially poorer than incomes suggest because of a combination of shorter lives and extreme inequality.
re-write Claim: Most developing countries are “substantially poorer” than incomes suggests.
re-write Claim: “developing countries” life expectancy is “low” compared to “developed countries”
etc…
-
Have not answered claims about the future with “might”, “would”, “could”. Please let me know at the claim itself if I could have done better.
-
What all counts as EE, Calculations counts as EE? Cost-effectiveness Calcs from GiveWell (?)